Odin offers a rich GUI that allows many actions: graph visualization, synoptic (instantaneous sensor values), as well as more advanced option as a logbook errors, sensors calibration, setting some parameters of controllers and their activation/deactivation.
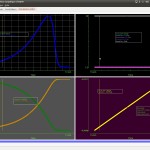
 Graphes :
Viewable from 1 to 4 at the same time, with 6 curves for each, you can configure as desired by using the right clic of the mouse on a curve (background color, curves, railings, steps, time elapsed since begining of the experience, adding / removing a curve, …)
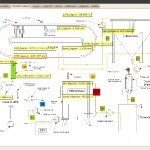
 Synoptics :
Give you the opportunity to display some or all sensors and actuators on a white page or add an image. You’ll see in real time the last value mesured (wich will be displayed in red if out of the validity domain if you have defined it).
With a right clic, you can update the list of sensor, change the size of the text,…
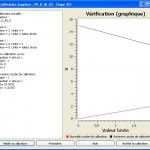
 Calibration :
give you the possibility to calibrate the sensor (one or more at the same time)
Parameters of a controller:
You can, for the GUI, change the value of the “set point” of a controller.

