
This page is divided into 2 parts, the first presenting the manipulations to create your first graph, your first synoptic and your first calibration. And a second with all the options of the GUI.
When you launch the GUI for the first time, a little message tells you that he has not found the previous configuration and will use the default configuration.

You could also get this message if you change your configuration and he could not find the some sensors/actuators.

This page is quite long, you can go directly at the chapter you looking for with the following link :
– Default tabs
– First steps :
Create your first synoptic
Create your first graphe
Calibrate sensor
Default tabs
Warning!
Your can rename all the tabs if you want. You can remove the graph and synoptic tabs. To do this you only need to use the right click on the name of a tab- Journal : Display all malfunction more or less critical. More the color is dark red close the message may be more important for the functioning of Odin, controllers and observers
(some messages may appear at startup because all devices are not launched, they are less severe. However, if new messages appear later, it mean that there is a problem).
- Setpoints : We will talk more of them in the section Controller. Some parameters of a controller could be modify here.


- Controllers : We will talk more of them in the section Controller. We can enable or disable a controller here. You can also change the default value to send when we disable the controller or stop Odin (could be a real or the word “last” – which mean that we will keep the last value).
- Sequences : We will talk more of them in the section Sequence. You can read sequence information here, start a manual sequence or stop a sequence (soft and hard way)
First steps
We want first to read the instantaneous value of the sensors that have been connected. Then the curve of some sensors/actuators, and finally, as some values are not consistent, we will calibrate the sensor used.
On veut dans un premier temps observer la valeur instantanée des capteurs que l’on a branché. Puis on observera la courbe de quelques capteurs/actionneurs, enfin, comme certaines valeurs ne sont pas cohérentes, on va calibrer le capteur utilisé pour que la courbe corresponde à nos attentes.
-
Create your first synoptic
Edit → Synoptic → Create a synoptique
 Choose a background image or leave the default image (white image.
Choose a title for your synoptic, this title will be use to save your synoptic (then could load it later if you close it) and the name of the tab. We will call the our sinoptic “Tutorial demo”.
 You can move the labels by dragging them (left click on a label and moving the mouse while holding the button down).
If now you want to change the configuration of our block, right-click the page opens the edit menu The update of the modifcation will only be appliedwhen you click on the button Validate/Save modifications
- If you want to change the size of text on a label, you must click on the first button, select and edit the value label. You can repeat as many times as necessary on different labels.
- Add items give you the possibility to add some sensors/actuators on the synoptic
- Remove items allow you to remove some sensors/actuators of the list.
- Change the background
- Remove the synoptic only delete the tab (you can reload it later)
- Number after decimal point help you to get a better visibility or precision buy rounding values displaued
- Change the title only change the title not the saved file
- Bloc/Unbloc the position : fix or unfix all the labels
You can have a nice synoptic that help you to visualise all you manupulation

-
Create your first graphe
Edit → Graphe →New Graphe(s) page
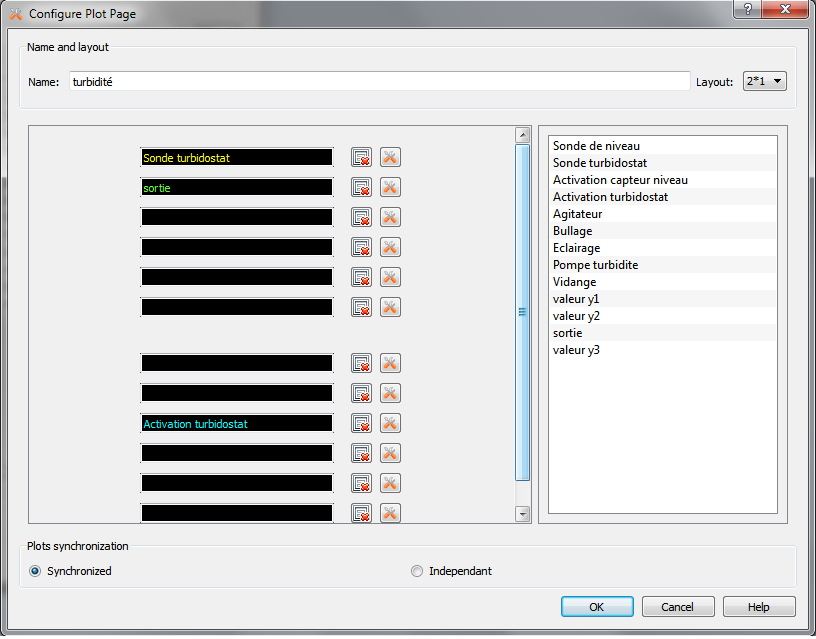
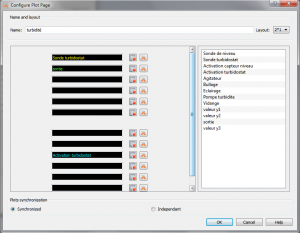 We have the opportunity between creating one graph in a tab, 2 * 1 (2 graphs side by side), 3 * 1 (3 graphs side by side), or 2 * 2 (4 graph square shaped).
You can name the graph (the name that will appear on the graph associated with the tab and will be used to save the configuration).
If you display more than one graph, you may want the time curve is the same for all graphs (ie, synchronized). If you prefer that each has its own time scale, choose independent.
To now add sensors / actuators to a graph, you must drag in the black boxes (ie go to a name, hold down the left mouse button down and move the mouse to a black box and release the button). You can change the color of the curve of a sensor by clicking on the image
 You can move the label with value of oa point by dragging them
To modify the information of a graphe, you juste have to right-click on the graphe.

- The menu that appears allows you to modify the curves (modification, deletion, addition), color, number after decimal displayed.
You can also add a grid ,markers on the axes, a tag with time elapsed.
Finally you can rename the axes and change axis scales. -
Calibrate a sensor
The calibration need 3 steps
- Step 1 : Selection sensor(s)
 For this step, select the sensor(s) that need(s) to be calibrated
Select the degree of the polynomial curve that will fit the calibration curve and the number of points required for the calibration (it must be strictly greater than the degree of the polynomial).
Finally, the calibration does not prevent Odin to run, you must choose a behavior for the sensor(s) while the calibration is on process (required for observers and controller using the information of the sensor). [Warning] Once the clicking on Start calibration, a message tells you that you can now remove the sensor from the experimentation. Do not do it before![/warning] - Step 2 : Value to compute the calibration
 You will now write/get the value of the measurement points. In the first column, the desired (in our example the expected temperature) values and in the right column the value given by the sensor is indicated (you can either enter manually or ask Odin to retrieve the current raw value).
You must Fix the value for each point.
If you want to sharpen your calibration, it is always possible to add extra points. - Step 3 : Verification and validation

This step is to certify that the curve obtained is consistent with what is expected.
In red is shown the new curve and the old in black.
On the left we have the parameters courbe.Vous can now validate the calibration. A message when you will tell you that you can put the sensor back in the experiment.
- Step 1 : Selection sensor(s)


Les menus
- File:
- Choose ODIN’s process – advanced option : give you the possibility to choose which Odin we want to connect with (Odin is multiplateform, you can then have the choice between an Odin from different computer – if connected to the network)
- Load plot settings : give you the possibility to load and old configuration (if you saved it)(by défault, the most recent is used, saved in the file ui-settings.xml)
- Save plot settings : To save the current configuration. Do not forget to add the extension (.xml).
- Open XML file– advanced option : open a windows to the folder with all the configuration files (UI, Supervisor, devices).
- Open logs folder : open a windows to the folder with all the saved datas (including exported data).
- Edit:
- Graphe : to create a new graphe or load a old one
- Calibrate un capteur : To start a calibration or read the explication about calibration
- Synoptic : to create a synoptic, load a synoptic or get information about a synoptic
- Help:
- Help : A summary of the functionnalities of the GUI
- About ODIN : version, copyright,…