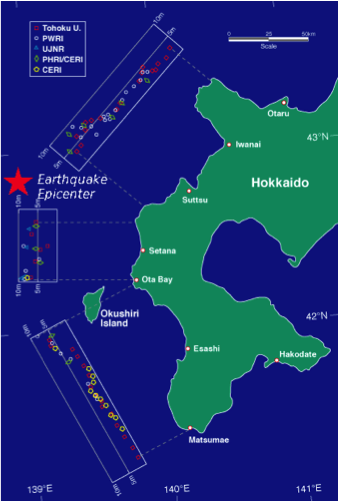
The origin of the 1993 the Hokkaido-Nansei-Oki tsunami is an earthquake with epicentre offshore the island of Okkaido in Japan. The Tsunami wave has rapidly propagated and hit the Japanese coast. The highest damage has hit the island of Okushiri where water has covered heights up to 30 meters literally washing away the Monai village.
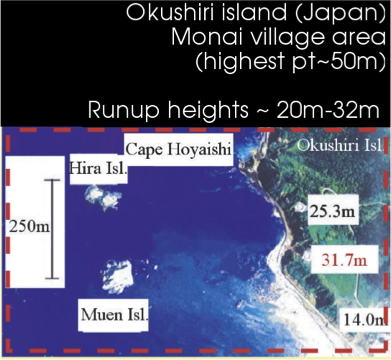
In 2004, as part of a workshop organized by the US National Science Foundation, an experiment has been set up, reproducing the impact of the Tsunami wave on the shore of the Okushiri island, in the Monai village area. The objective of the experiment was to provide a set of well organized data, reproducing the 1993 Tsunami event, to validate numerical codes for Tsunami simulation.
This has become a common test involving the inundation of complex coastal environnements. It is one of the main WP1 benchmarks of the PIA research program TANDEM. Detailed data and more information can be found on the 2004 workshop web site as well as on the web of NOAA’s Center for Tsunami Research.
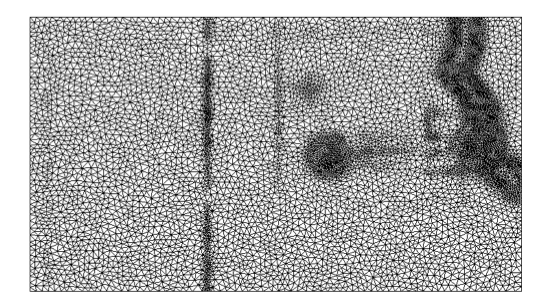
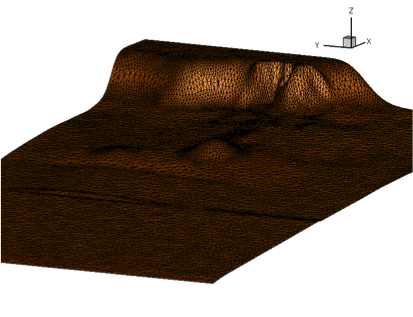
The numerical simulations are performed with the residual distribution schemes developed in the team and on an unstructured grid, adapted to the bathymetric data using the MMG platform.
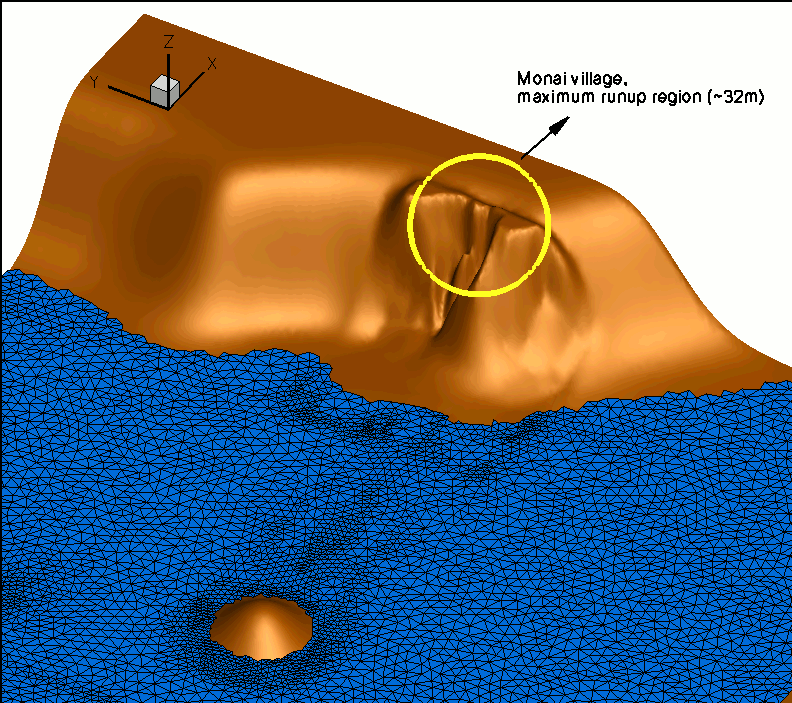
The schemes developed in CARDAMOM, currently implemented in the code SLOWS, allow to reproduce the large inundation of the Monai valley region, with inundation heights very close to those observed in the experiment, and in the real event.
To further illustrate our activity we will consider two issues. The first is how can we reduce the simulation time ? A way to do this is to use a dynamic adaptation strategy in which the grid evolves during the simulation. One way to achieve this is to modify the initial grid (adapted to the static bathymetry), by deforming it in an adaptive manner.

This approach allows to provide similar the wave dynamics and, more importantly, inundation characteristics (runup) with a third of the computational cells. This technique alone is shown to provide alone CPU time savings of more that 35% . Much is left to do to further improve this result but the potential is of course very high!!
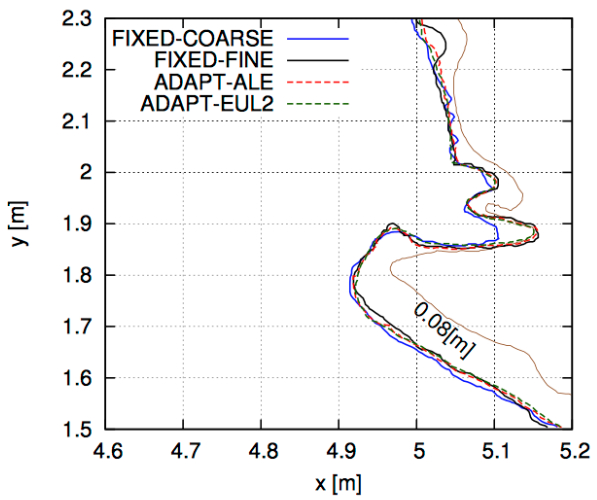
Monai Valley: RUNUP plot
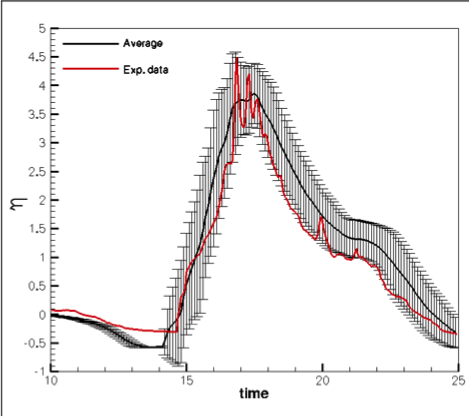
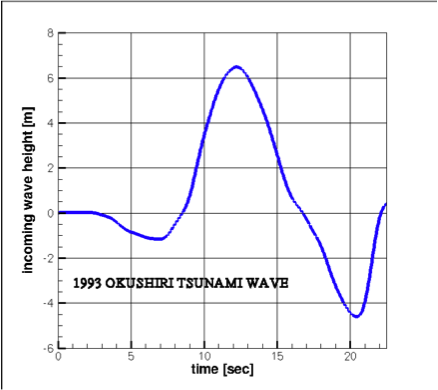
Another key problem for this type of simulations is “how to make sure that the prediction obtained is reliable and that a much larger region will be affected”? This can be answered by including in the simulations an estimation of the propagation of uncertainties in e.g. the amplitude of the incoming wave. This Uncertainty Quantification (UQ) step involves a clever exploration of the stochastic space defined e.g. by the average expected amplitude of the signal (in time, as in the right figure), plus a variation given by, for example, a Gaussian distribution (or any other probability density function). In this case, the simulation results cannot be presented as a simple curve anymore as the information on the variability of the outputs is also available. The simulations results will have to be understood in terms of an average (expected) value plus-minus the deviation computed by the Uncertainty Quantification method used, as shown in the figure for the data in an experimental probe for the Monai valley experiment.
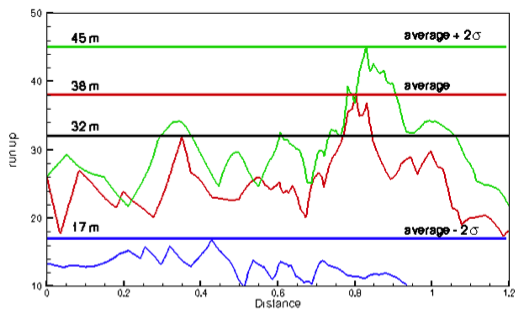
For this case, in particular, we have estimated using the model and the UQ libraries initially developed in the CARDAMOM team that a simple variation of the amplitude of 10% around its average value can lead to significant local variations of the water levels with deviations of the runup heights along the coast up to more than 30% (left picture)!
This toy problem shows the potential and the importance of the tools developed in the team.