These simulations have been performed in the context of the project TANDEM led by the French atomic energy commission CEA. The problem involves the solution of the shallow water equations in curvilinear (spherical) coordinates. This has been done using the implementation in SLOWs of a well balanced residual distribution discretization of the shallow water equations in an original ALE form. The required data for the simulation (bottom topography and initial wave height) have been provided by the BRGM. On figure 1 we report a close up view of the underlying meshes embedding (and refined around) the initial coastline, and the initial water elevation.

Figure 1. Left: Meshes embedding the initial coastline (Iwate prefecture). Right: initial water elevation (obtained at BRGM using the method by Satake et al.)
As they approach the coastline, the waves shoal with heights which exceed 10 meters. This phenomenon can be captured on relatively coarse grids thanks to the adaptive moving mesh method used here. A visualisation of the waves as they propagate toward the prefectures of Iwate and Myagi, north of the Sendai bay, is reported on figure 2. The colours in the top row allow to visualize the height of the waves which clearly become more and more thing and tall. The bottom row show the meshes resulting form the adaptation process (adaptation w.r.t. the free surface level).
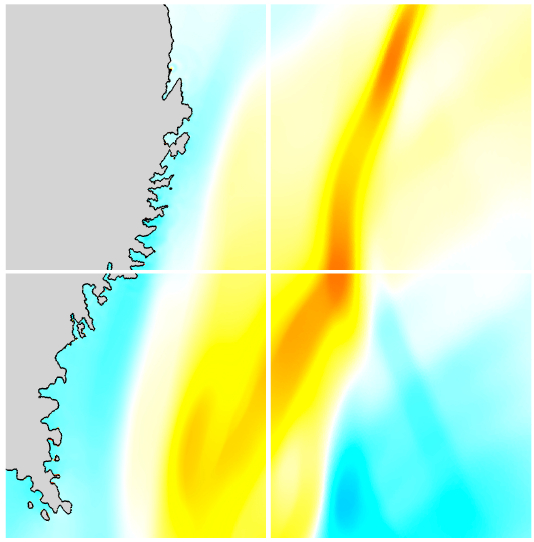
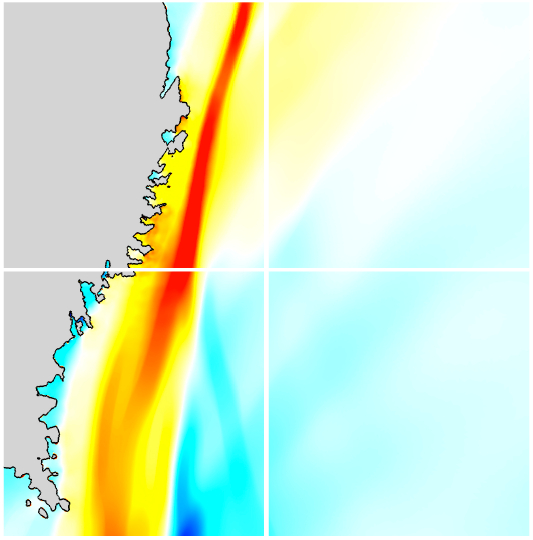
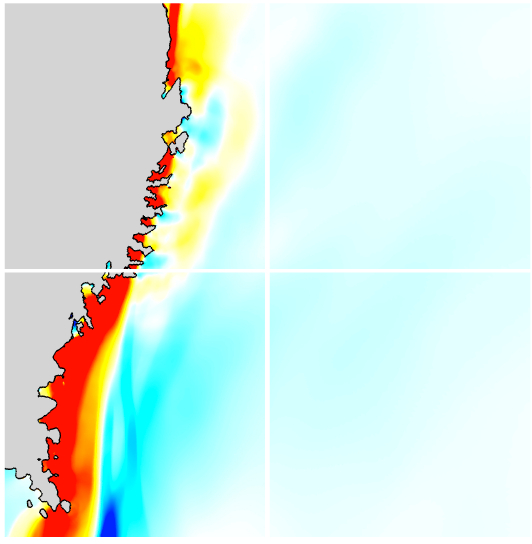
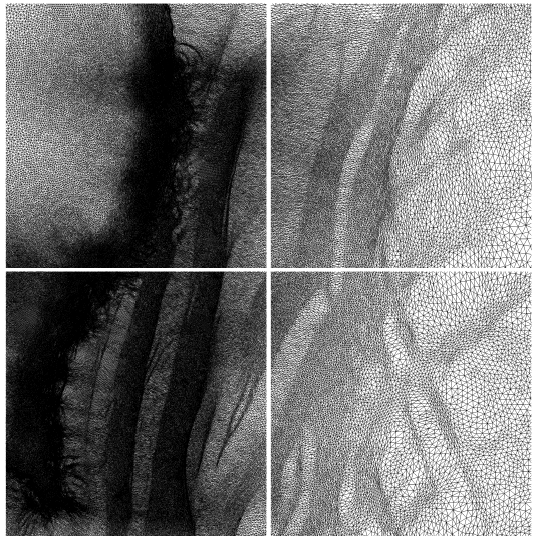
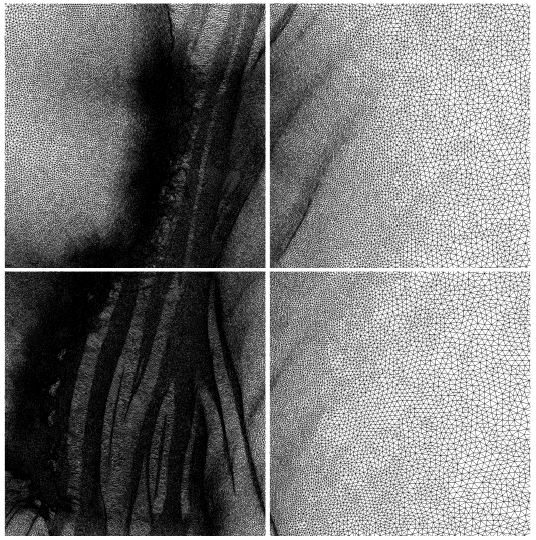

Figure 2. Waves approaching the Iwate and Myagi prefectures after 10 (left), 20 (middle), and 30 minutes (right) of propagation. Top: water elevation. Bottom: adapted moving mesh.
In figure 3, we visualize further the waves approaching the Sendai area (right north of the Daiichi Nuclear power plant), entering the bay and flooding the coastline. Again we show both free surface levels and adaptive moving mesh to highlight the ability of the method developed to capture the wave fronts. Finally, figure 4 shows a comparison with some of the field data available from the real event. The top row shows the inundation of the Irate prefecture, and in particular the runup plot (rightmost picture). The bottom row reports the comparison of the computed wave heights in the GPS buoys. The adaptive mesh movement allows to divide by two the necessary number of elements required to capture the highest waves.

Figure 3. Wave approaching the Sendai area (top row) and entering Sendai bay (bottom row). Left: free surface. Right: adaptive moving mesh. Dry nodes are blanked.
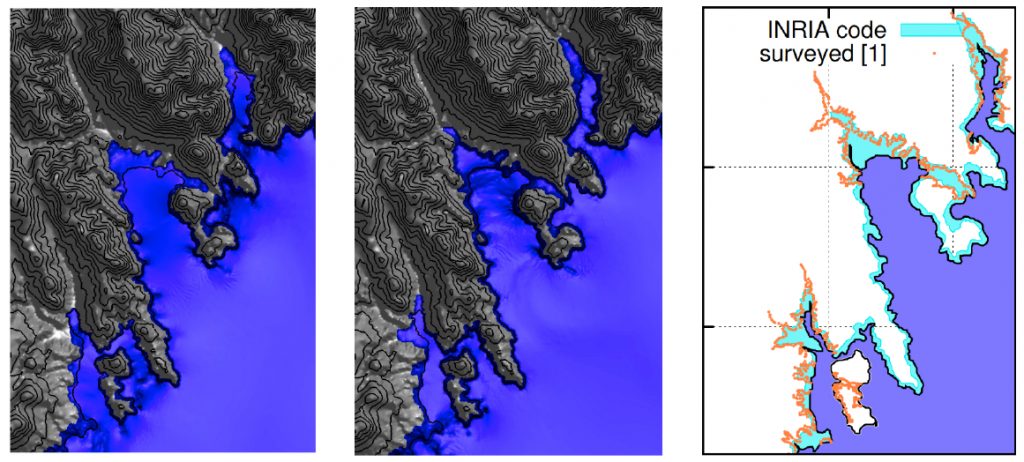
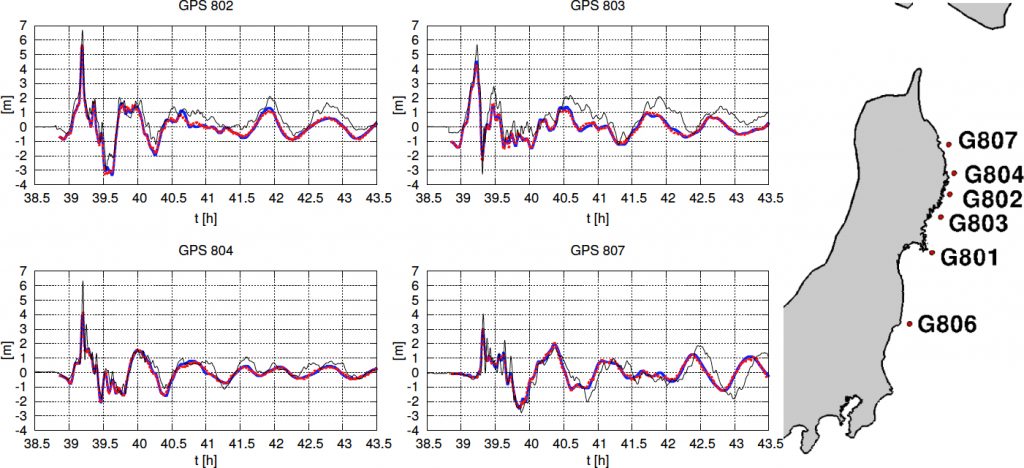
Figure 4. Comparison with field data. Top: flooding in the Iwate prefecture after 40 (left) and 50 (middle) minutes of propagation, and runup plot on the fine mesh (right, surveyed inundation points in red, computed inundated region in light blue). Bottom: comparison of the computed wave height time series in the GPS buoys. The black lines are the data, the red the adaptive computation, and the blue a reference computation on a mesh containing twice as many elements.