Supramodal processing optimizes visual perceptual learning and plasticity
Multisensory interactions are ubiquitous in cortex and it has been suggested that sensory cortices may be supramodal i.e. capable of functional selectivity irrespective of the sensory modality of inputs. Here, we asked whether learning to discriminate visual coherence could benefit from supramodal processing. To this end, three groups of participants were briefly trained to discriminate which of a red or green intermixed population of random-dot-kinematograms (RDKs) was most coherent in a visual display while being recorded with magnetoencephalography (MEG). During training, participants heard no sound (V), congruent acoustic textures (AV) or auditory noise (AVn); importantly, congruent acoustic textures shared the temporal statistics – i.e. coherence – of visual RDKs. After training, the AV group significantly outperformed participants trained in V and AVn although they were not aware of their progress. In pre- and post-training blocks, all participants were tested without sound and with the same set of RDKs. When contrasting MEG data collected in these experimental blocks, selective differences were observed in the dynamic pattern and the cortical loci responsive to visual RDKs. First and common to all three groups, vlPFC showed selectivity to the learned coherence levels whereas selectivity in visual motion area hMT+ was only seen for the AV group. Second and solely for the AV group, activity in multisensory cortices (mSTS, pSTS) correlated with post-training performances; additionally, the latencies of these effects suggested feedback from vlPFC to hMT+ possibly mediated by temporal cortices in AV and AVn groups. Altogether, we interpret our results in the context of the Reverse Hierarchy Theory of learning in which supramodal processing optimizes visual perceptual learning by capitalizing on sensory-invariant representations – here, global coherence levels across sensory modalities.
Interplay between functional connectivity and scale-free dynamics in intrinsic fMRI networks
Studies employing functional connectivity-type analyses have established that spontaneous fluctuations in functional magnetic resonance imaging (fMRI) signals are organized within large-scale brain networks. Meanwhile, fMRI signals have been shown to exhibit 1/f-type power spectra – a hallmark of scale-free dynamics. We studied the interplay between functional connectivity and scale-free dynamics in fMRI signals, utilizing the fractal connectivity framework – a multivariate extension of the univariate fractional Gaussian noise model, which relies on a wavelet formulation for robust parameter estimation. We applied this framework to fMRI data acquired from healthy young adults at rest and performing a visual detection task. First, we found that scale-invariance existed beyond univariate dynamics, being present also in bivariate cross-temporal dynamics. Second, we observed that frequencies within the scale-free range do not contribute evenly to inter-regional connectivity, with a systematically stronger contribution of the lowest frequencies, both at rest and during task. Third, in addition to a decrease of the Hurst exponent and inter-regional correlations, task performance modified cross-temporal dynamics, inducing a larger contribution of the highest frequencies within the scale-free range to global correlation.
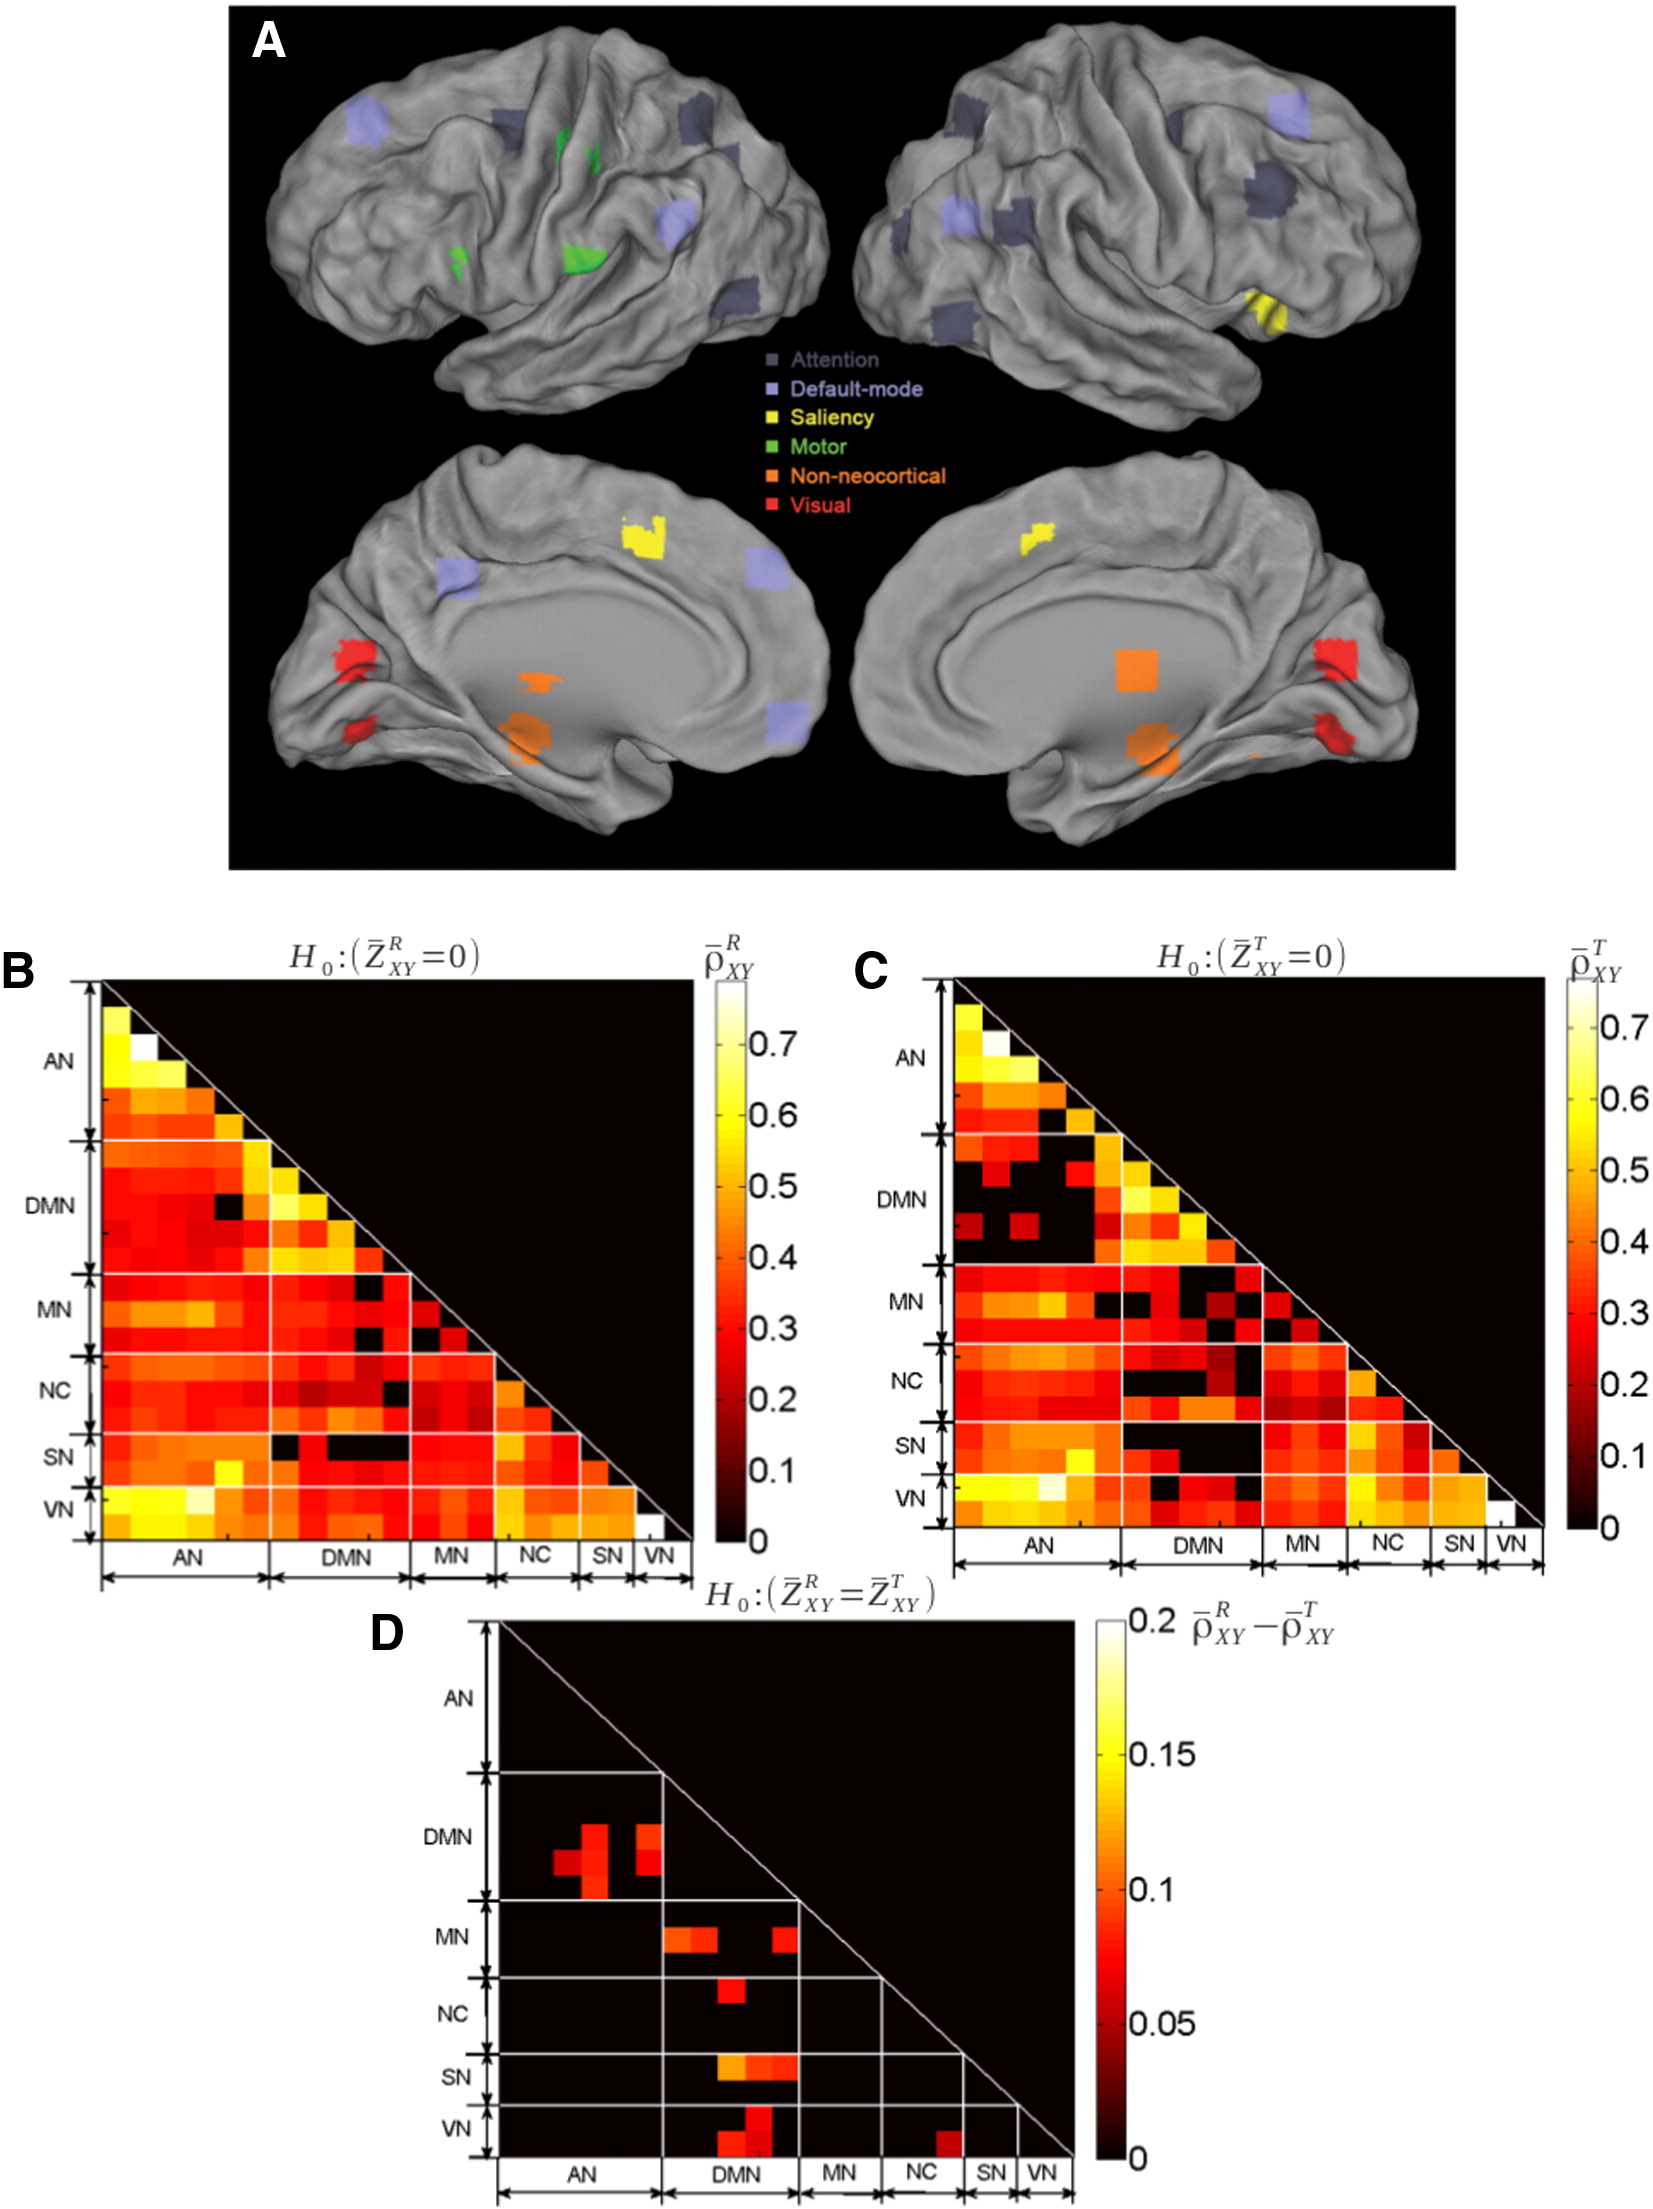
etworks definition and correlation structure. Top (A): ROIs mapped onto the cortical surface, with each color denoting a different network. Middle (B): Group-averaged inter-regional correlation matrix at rest (p < 0.05, Bonferroni corrected). Regions are grouped by network to ease visualization. Middle (C): Group-averaged inter-regional correlation matrix during the visual detection task (p < 0.05, Bonferroni corrected). Bottom (D): Difference of the correlation coefficients between rest and task (thresholded at p < 0.01, uncorrected, two-sample t-test for rest vs. task). The ROIs are grouped by networks; these networks correspond to the diagonal triangles surrounded by white dashed lines.