El Niño – La Niña oscillations
Climate in the Pacific areas, from Australia to the Americas coastline, is strongly influenced by the ENSO phenomenon (El Niño Southern Oscillation : El Niño / La Niña) corresponding to irregular oscillations of the sea surface temperature of the Pacific Ocean and winds [1]. At the maxima of these oscillations, each end of the continental areas are impacted in opposite ways : during the El Niño phase, huge rainfall events [2] create devastating floods on the Pacific South American coastline (the most affected countries are Peru and Ecuador), while severe droughts and fires impact opposite regions (Australia, South East Asia, India) ; during the La Niña phase, the impacts are reversed.
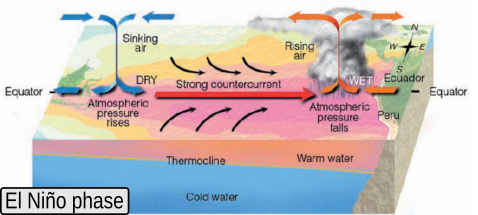
Source: Meteorology today (Ahrens, D., Henson R. 2009, p 277).Click to toggle El Niño / La Niña.
Study of this natural process is obviously of huge importance for the population in these areas. Any progress in the comprehension and in the predictability of the El Niño Southern Oscillation (ENSO) has potentially huge societal impacts.


Participants
- Nicolas Brodu: Data analysis, computational mechanics, complex systems
- Luc Bourrel: Hydroclimatology, ENSO phenomenon, South America
- Pedro Rau: Hydroclimatology, ENSO phenomenon, Peru, Andes
General Approach
We focus especially on the area of the Pacific coast and slope (Andes) of Peru. A thorough data collection (climatological, meteorological and hydrological) and hydrological modeling allows us to exploit historical data from the 1970s to the present (50 years of monthly data) [3]. We monitor the runoff of 49 river catchments, together with measured precipitations and temperatures over their watersheds. We are then able to define regions with homogeneous hydroclimatology [4]. Four indices of sea surface temperature aggregate the influence of distinct zones of the Pacific Ocean on the ENSO phenomenon. Taken together, this approach allows to study the ENSO effects on separate regions talking into account the latitudinal (around 3 000 km) and altitudinal (0 to 6 500 m.a.s.l.) gradient of the study area (e.g., wet or arid, coastal or montainous, etc). Thanks to this extensive data collection and analysis, we can now envision:
- The study of the ENSO effects on separate regions defined by consistent climatic and hydrologic properties (e.g., wet or arid, coastal or montainous, etc). In particular, we aim at identifying the main influential factors that trigger extreme events in each region.
- Studying the ENSO dynamics globally, extracting its dynamics from data. We do not build an overly detailed model of the 3 components – oceanic, atmospheric and continental cycles – and their interactions involved in the ENSO phenomenon processes. This would comprise too many internal parameters and cannot be reliably fit to the measured data. In contrast, we use a global approach in order to build an integrated model of the regionalized ENSO dynamics.
- Train this integrated model on historical data set and attempt to produce reasonable predictions for each region, over the 3, 6 months to 1 year range, or at least early warnings (with probability degree associated) that the model states deviate from normal and may lead to an extreme event. This is detailed below.
Our objectives
Given the complexity of the task, we have set ourselves progressive objectives:
- In a first time, attempt to reconstruct the main seasonal patterns, outside extreme El Niño / La Niña events. This model would capture the main influencial factors impacting each region and allows to calibrate physical values, such as memory/reservoir effects, in each region. In order to do this, we are going to apply the Concaust method [5], currently being developped by the team. It shows promising capabilities for reconstructing the natural processes dynamics and attractors from data. The method is able to assimilate heterogenous data and to make predictions for each dependent variable, while retaining a good degree of interpretability.
- In a second time, introduce the extreme events in the model. The problem is that each Niño extreme is different, with statistically not enough realizations for building an accurate model from data only. This is a classical issue with rare events. However, we can still hope that the premisces of these rare events can be reliably captured by the model as they obey similar patterns in measured data (sea surface temperature, etc). Even though we may not be able to predict extreme events with the same accuracy, we can at least hope to predict their general amplitude (week, moderate, strong and extreme events).
- We plan to use the knowledge we’ll have extracted along the way in order to complement and correct the model over time. Our goal is to produce at least early warnings, exploiting that the model state deviates from the normal regime in a way that typically leads to extreme events.
Preliminary results
Reconstruction of attractor projected on the main 3 parameters found by the Concaust method. The image is dynamic and you can navigate through the structure.
Analysis
The above dynamic plot shows an attractor for the full ENSO dynamics, encompassing all regions. Each data source is considered separately: sea surface temperature indices, precipitations and regional runoff. This reconstruction uses a “memory” of 5 years and monitors statistical dependencies of that past window over the next year. The extreme events of 1982/83, 1997/98 and 2016/17 clearly stand out, as well as the seasonal cycles. The Niña years seem to be well clustered on the center and near the top of the structure (navigate and zoom in the structure to see this), while large events are located far away from the center and at the bottom. Note that the attractor is multi-dimensional and its full structure cannot be apprehended with only this projection.
This preliminary result is very encouraging. One strength of the model is to reconstruct the global dynamics, taking in account data from multiple sources. Predictions are already possible on a per-region basis using this global model, which is a strength of the method: predictions for each dependant variable incorporate knowledge coming from the full data set. However, each region is defined by homogeneous hydroclimatically characteristics and this also needs to be taken into account for building the global model itself. Indeed, each region is defined by hydroclimatically consistent, but distinct properties. For example, reservoir effects probably differ between the wet northen regions and the most arid ones in the south. That should be reflected in the amount of “memory” we retain from the past, which can be specified seperately for each data source in each region. Similarly, the choice of a kernel bandwidth implicitly selects a sensitivity to the level of details, whether to focus on small variations or on large changes. Some data can be too noisy, so that focusing on these small variations is irrelevant and would decrease the accuracy of global predictions. On the other hand, selecting a too large scale of analysis makes all data similar, so the important dynamics can also be missed. These regionalized parameters and scales could be speficied from prior knowledge and fine-tuned by cross-validation techniques.
Our priority now is to define relevant objective criteria for optimizing the model, but this presents technical difficulties in the presence of rare events as mentioned above. Hence the two-step approach, where we’ll attempt to first reconstruct the normal dynamics, then see what needs to be changed in the model in order to improve the accuracy for predicting the apparition of extreme events. There are also engineering challenges to address before running cross-validation. Work is slowly progressing in these directions.
If you are interested in this topic, we welcome new collaborations! We may also recruit, so please do not hesitate to contact us.
References
[1] Bourrel L, Rau P, Dewitte B, Labat D, Lavado W, Coutaud A, Vera A, Alvarado A, Ordoñez J. (2015): Low-frequency modulation and trend of the relationship between ENSO and precipitation along the northern to centre Peruvian Pacific coast. Hydrological Processes 29(6): 1252-1266.
[2] Sanabria J, Bourrel L, Dewitte B, Frappart F, Rau P, Solis O, Labat D. (2018) : Rainfall along the coast of Peru during strong El Niño events. International Journal of Climatology 38(4): 1737-1747.
[3] Rau P, Bourrel L, Labat D, Melo P, Dewitte B, Frappart F, Lavado W, Felipe O. (2018): Assessing multidecadal runoff (1970–2010) using regional hydrological modelling under data and water scarcity conditions in Peruvian Pacific catchments. Hydrological Processes 33 (1) 20-35.
[4] Rau P, Bourrel L, Labat D, Ruelland D, Frappart F, Lavado W, Dewitte B, Felipe O. (2017): Regionalization of rainfall over the Peruvian Pacific slope and coast. International Journal of Climatology 37(1): 143–158.
[5] N. Brodu, J.P. Crutchfield : Discovering Causal Structure with Reproducing-Kernel Hilbert Space ε-Machines. https://arxiv.org/abs/2011.14821