


We develop new mathematical tools that quantify legal risk.
Through the study of case law databases, we are able to model decisions and create powerful tools for analysis and prediction.
Provisions for legal risks, big data and machine learning
In a dispute, any company wants to know its risk of being convicted, and if so, the amount it is bounded to pay. However any dispute involves elements of unpredictability, e.g. related to the judge’s appreciation. We have developed a new technology based on machine learning methods that can reflect the range of decisions that would be made by a representative population of judges. Our mathematical model is able to create “virtual judges” deciding on all cases occurring in a well-defined area. Instead of giving a probable average value for the amount of the indemnity and/or damages, we quantify the probability of being convicted and provide the statistical distribution of related amounts. This richer information allows companies to provision their legal risks with an approach similar to the one they routinely use for their financial risks. For instance, a “legal Value at Risk” may easily be computed from this distribution. This refers to the maximum amount that the claimant could hope for, for a specific set of criteria, with a probability of, say, 95%. By varying criteria, one can also determine which situations are more or less favorable. This can also favor the use of amicable solutions.
Methodology
To start with, we analyze thousands of court decisions in light of a carefully designed array of criteria that are relevant with consideration to legal texts, case law, or in connection with the judges’ practice. This data then feed a machine learning system that creates our virtual representative population of judges. This technique accounts for the fact that any court decision involves an element of irreducible randomness. It also helps to fill two gaps: – it is rarely the case that all the relevant criteria for a given case are available, – most if the time, only a very small number of decisions for a set of fixed criteria is available; as a consequence, a simple statistical analysis is not sufficient to reflect the diversity of decisions, and it is necessary to build a mathematical model. In accordance with the practice in machine learning, the model is built on a learning set and validated on a separate testing set.
Examples
Assessment of the amount of the compensatory allowance
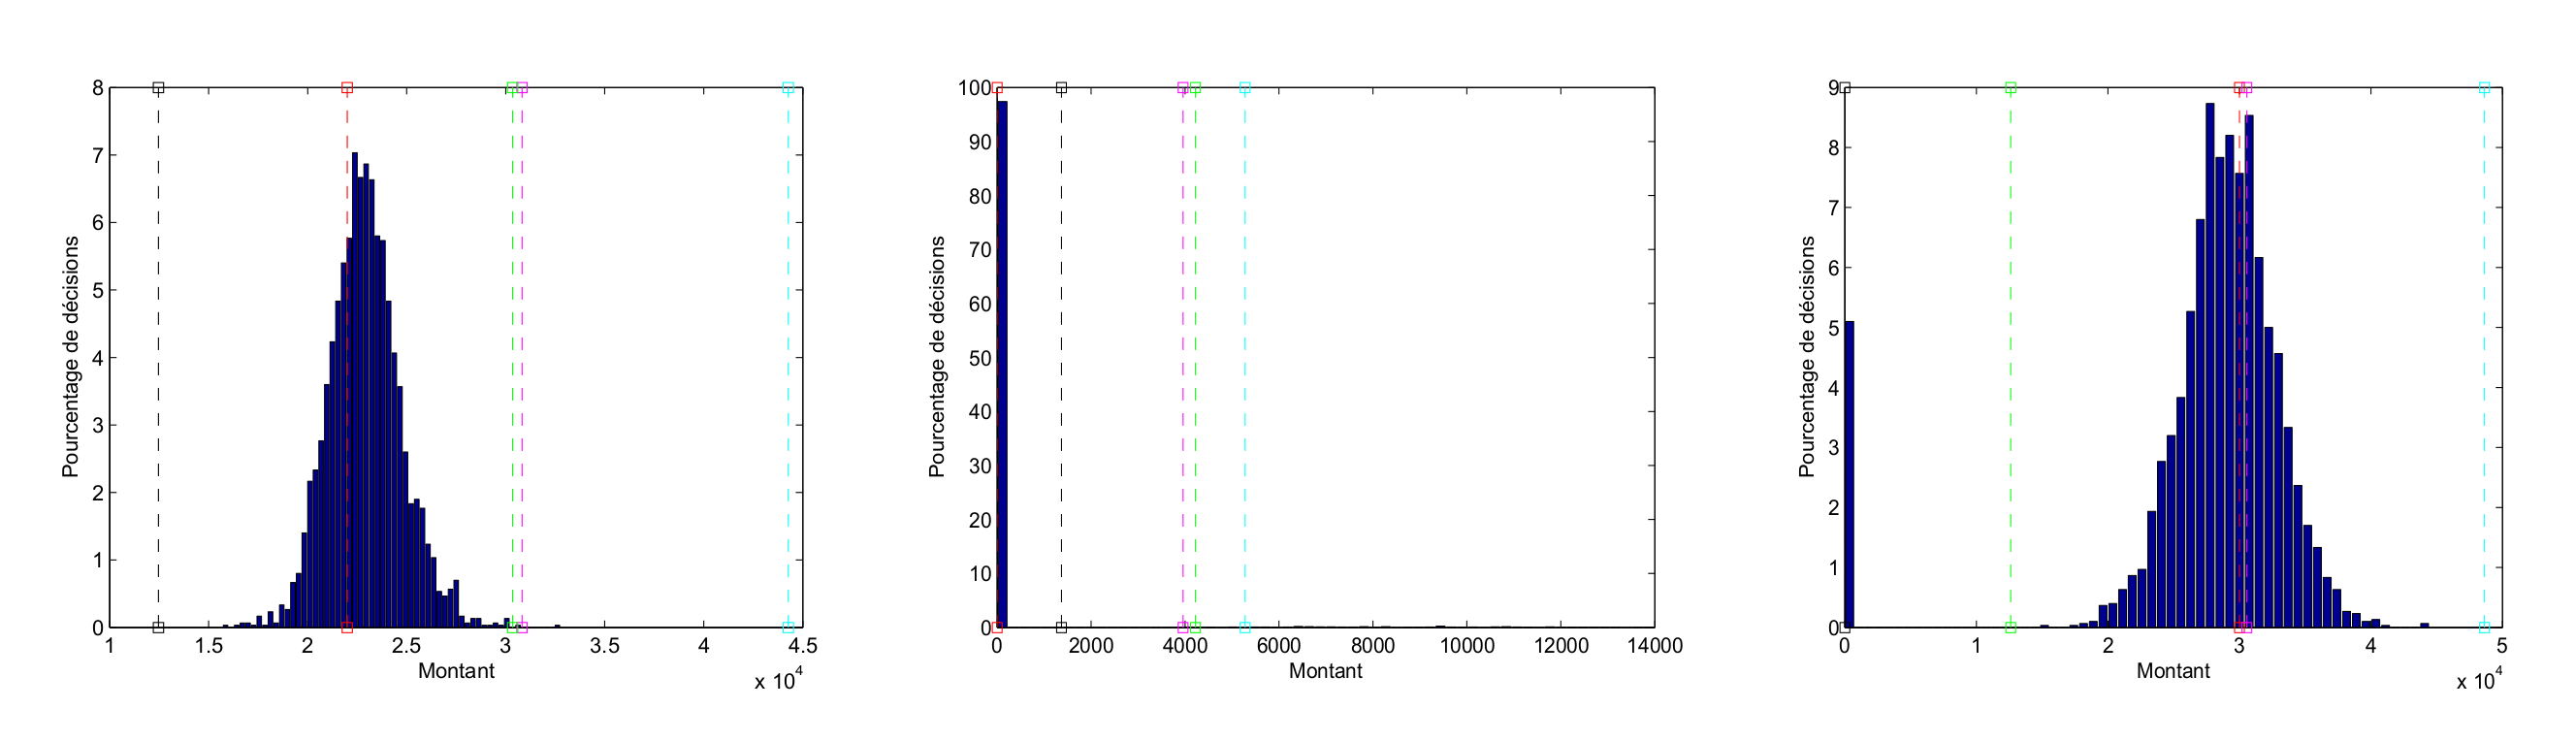
We have conducted a study for the French Ministry of Justice with the aim of determining the allocation (or not) of a compensatory allowance and, where appropriate, to estimate the probability distribution of its amount. Our array of criteria includes all the ones of Article 271 of the French Civil Code, as well as case law elements such as the duration of cohabitation after marriage and other criteria related to the professional practice of judges. We present below three examples of estimated statistical distributions (dark blue) for three actual cases. The amounts allocated are recorded on the abscissa, while the ordinate shows the percentage of virtual judges that have granted this amount. The value that was actually allocated for each case is marked with a red dotted vertical line. The other dotted vertical lines correspond to the amounts predicted by various scales of common use. An amount equal to 0 means that no compensatory allowance was granted. For example, in the second graph, our model predicts with probability 0.98 that no compensatory allowance will be allocated (98% of virtual judges do not grant allowance), which corresponds to the actual decision. In contrast, all usual scales accord a compensatory allowance.
Evaluation of the amount of compensation for dismissal without fair cause
We conducted a study for the office of the French Ministry of Economy, in view of determining the probability distribution of the amount of compensation awarded in cases of dismissal without fair cause. Our analysis grid here includes all French labor code criteria (article 1235-1 and following) as well as elements such as the age of the employee or the jurisdiction. Below are three examples of statistical estimated distributions (dark blue) for three actual cases. The abscissa presents the allocated amount (where the unit is the monthly salary) and the ordinate shows the percentage of virtual judges that would have granted this amount. The compensation that was actually allocated is marked by a vertical red dotted line.
