
Here you can find a list of our recent and ongoing projects.
2D and 3D covariance-based $\ell_0$ super-Resolution Microscopy with intensity Estimation (COL0RME)
Participants: Vasiliki Stergiopoulou, Luca Calatroni, Laure Blanc-Féraud, Sebastien Schaub, Henrique Goulart.
Publications: ISBI2021, Biological Imaging, ISBI2022
Super-resolution light microscopy overcomes the physical barriers due to light diffraction. However, state-of-the-art approaches require specific and often demanding acquisition conditions to achieve adequate levels of both spatial and temporal resolution. Analyzing the stochastic fluctuations of the fluorescentmolecules provides a solution to the aforementioned limitations. Based on this idea, we proposed COL0RME, a method for COvariancebased $\ell_0$ super-ResolutionMicroscopy with intensity Estimation, which achieves good spatio-temporal resolution by solving a sparse optimization problem in the covariance domain, discuss automatic parameter selection strategies, estimates background and noise statistics and includes a final estimation step where intensity information is retrieved. Several numerical results both on synthetic and real fluorescent microscopy images and several comparisons with state-of-the art approaches have been done. Our results show that COL0RME outperforms competing methods exploiting analogously temporal fluctuations; in particular, it achieves better localization, reduces background artifacts and avoids fine parameter tuning.
We also proposed a 3D super-resolution approach to improve spatial resolution in Total Internal Reflectance Fluorescence (TIRF) imaging applications. Our approach, called 3D-COL0RME improves both lateral and axial resolution by combining sparsity-based modelling for precise molecule localisation and intensity estimation in the lateral plane with a 3D reconstruction procedure in the axial one usingMulti-Angle TIRF (MA-TIRF). Differently from state-of-the-art approaches, 3D-COL0RME does not require the use of special equipment as it can be used with standard fluorophores. The proposed methods has been validated on simulated MA-TIRF blinking-type data and on challenging realMA-TIRF acquisitions, showing significant resolution improvements.
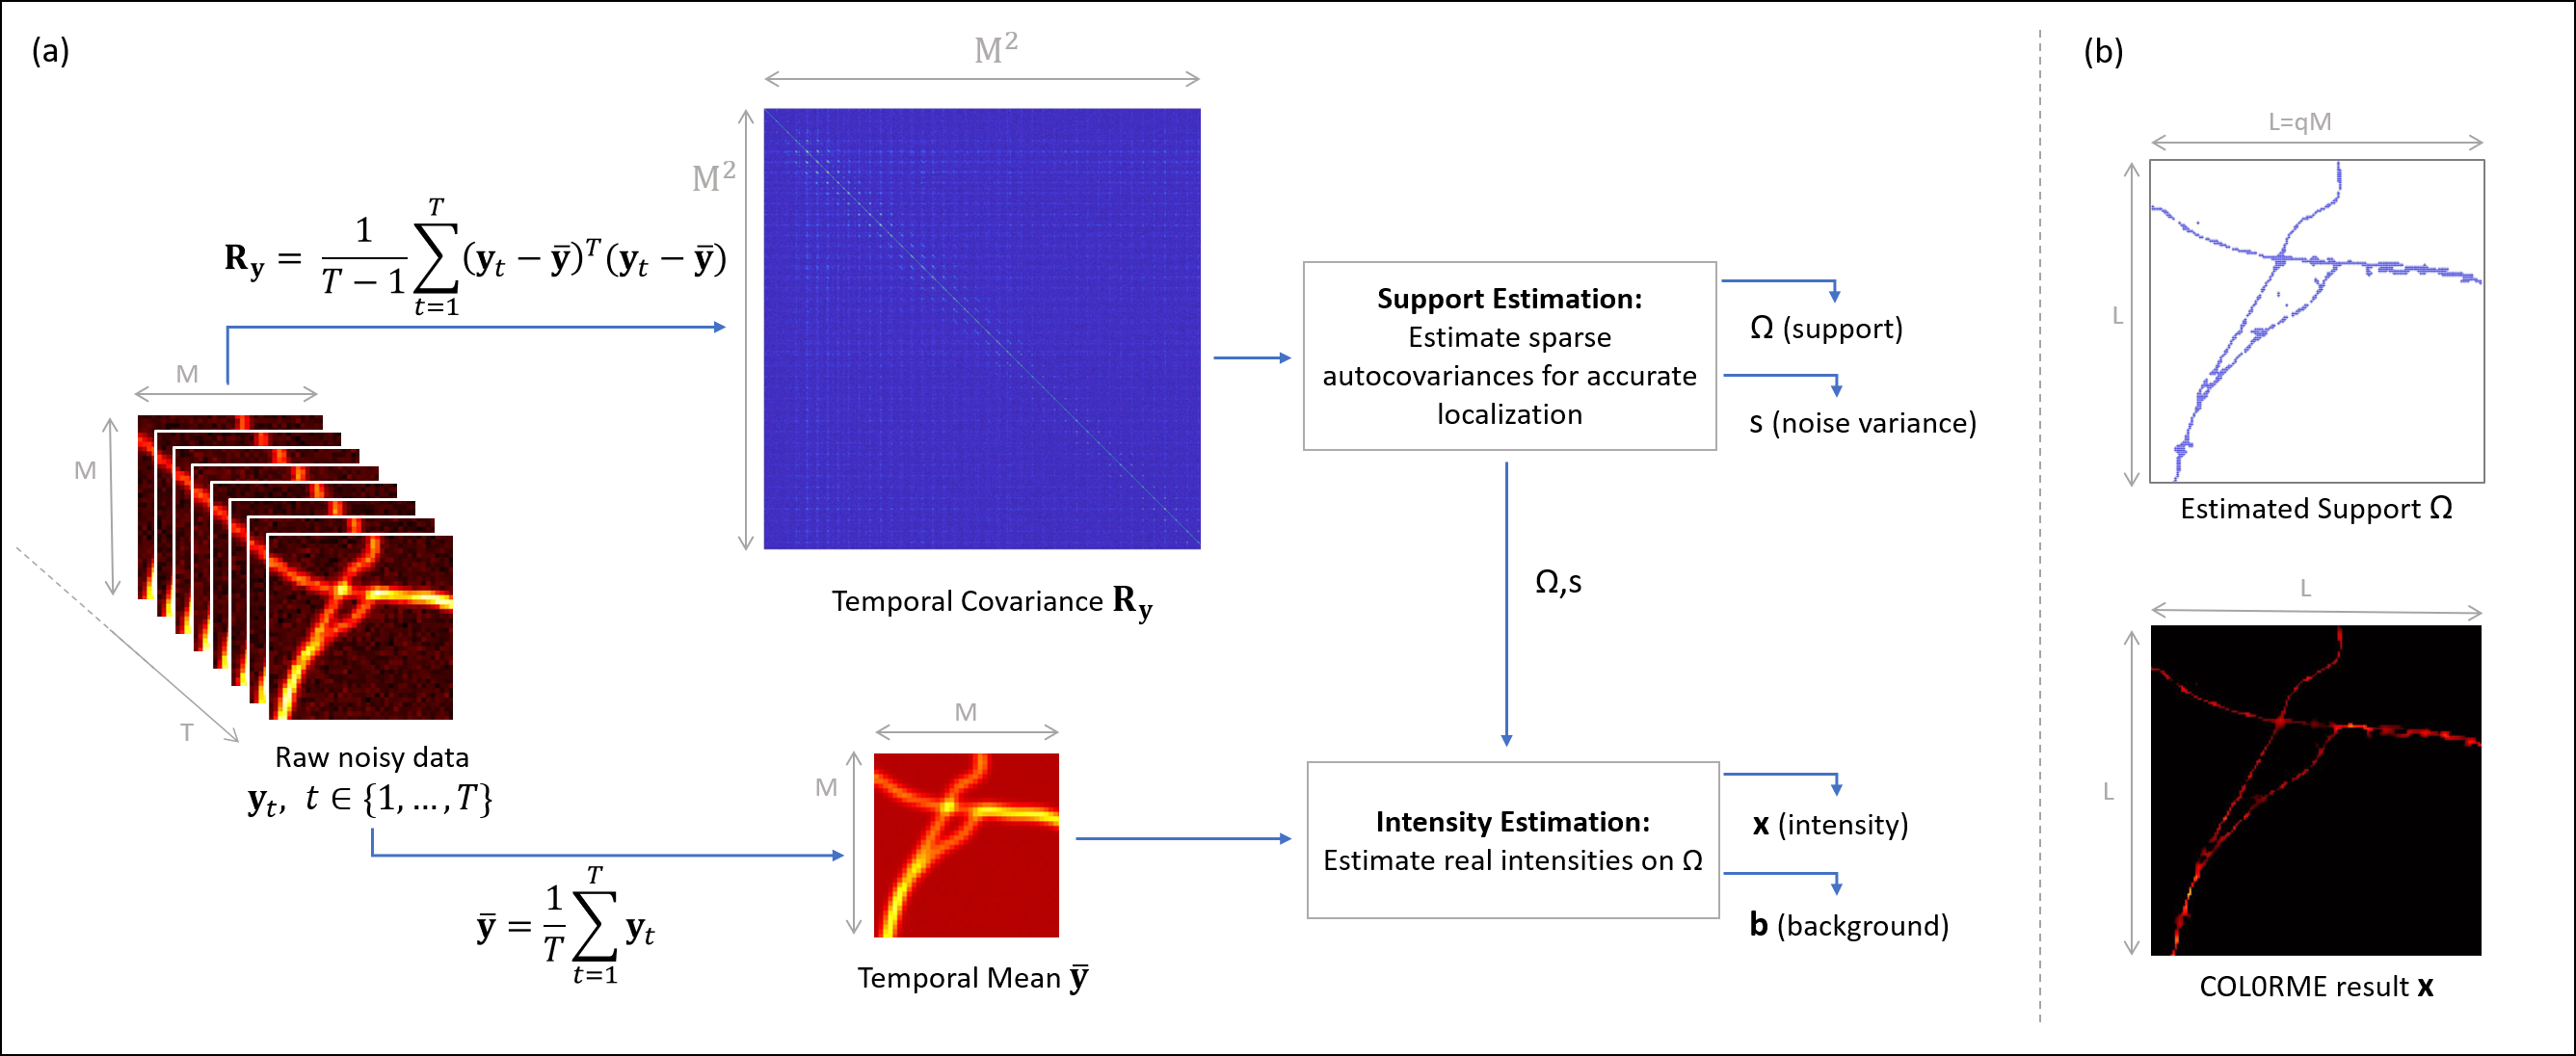 Principles of COL0RME. (a) An overview of the two steps (Support Estimation and Intensity Estimation) by visualizing the inputs/outputs of each, as well as the interaction between them. (b) The two main outputs of COL0RME are: the support containing the locations of the fine-grid pixels with at least one fluorescent molecule, and the intensity image whose non-null values are estimated only on the given support. |
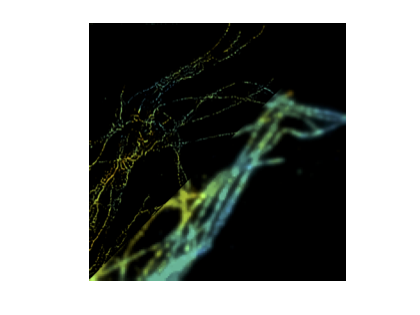 (Left upper part) super-resolved 3D-COL0RME image, (right lower part) standard MA-TIRF reconstruction. Colour quantifies sample depth. |
Off-the-grid dynamic super-resolution for fluorescence microscopy
Participants: Bastien Laville, Laure Blanc-Féraud, Gilles Aubert.
Publications: ICASSP 2022, preprint HAL.
Instead of standard discrete modelling where molecules are described as image pixels on a coarse (low-resolution) and fine (high-resolution) grid, off-the-grid variational methods models molecules as weighted sum of Dirac masses, i.e. as elements of the Banach space of Radon measures. In this context appropriate energy functionals are defined typically enforcing sparsity by means of Total Variation minimisation. We develop new gridless methods in static or dynamic settings, with applications to biomedical imaging. As of today:
- we implemented several algorithms for off-the-grid methods taken from the literature in a efficient and user-friendly Python module;
- we developed a new gridless method in a dynamical context. Through the definition of new operator and variational problem, we worked on the localisation of spikes with time-dependent amplitude (and static position), a proxy of the discrete COL0RME model.
Ongoing project consists in investigating a new approach to extend the off-the-grid theory (right now limited to points) to the reconstruction of more exotic structures like curves, from both theoretical and numerical standpoints.
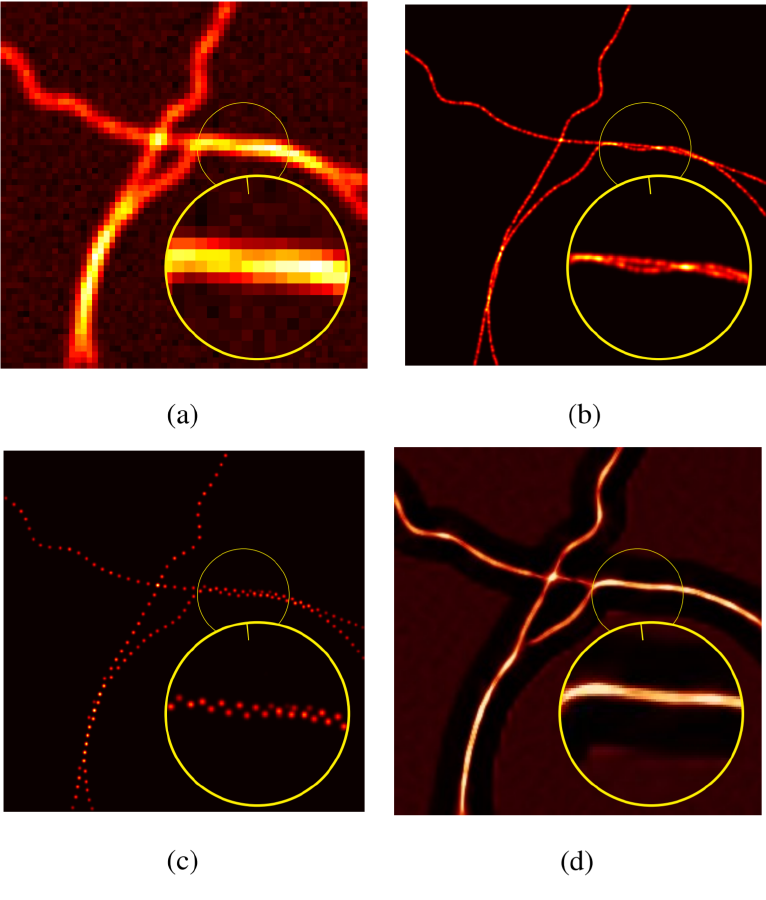
(a) fluctuation fluorescence microscopy acquisition; (b) ground-truth image; (c) off-the-grid covariance-based reconstruction; (d) Super-resolution Radial Fluctation (SRRF) reconstruction for comparison.
Correcting estimations of the copepod volume from 2-dimensional images
Participants: Cédric Dubois, Eric Debreuve.
Publications: Limnology and Oceanography.
Accurate plankton biomass estimations are essential to study marine ecological processes and biogeochemical cycles. This is particularly true for copepods, which dominate mesozooplankton. Such estimations can efficiently be computed from organism volume estimated from images. However, imaging devices only provide 2D projections of 3D objects. The classical procedures to retrieve volumes, based on the Equivalent Spherical Diameter (ESD) or the best-fitting ellipse, are biased. We developed a method to correct these biases. First a new method aims to estimate the organism body area through ellipse fitting. Then, the body of copepods is modeled as an ellipsoid whose 2D silhouette is mathematically derived. Samples of copepod bodies are simulatedwith realistic shapes/sizes and random orientations. Their total volume is estimated from their silhouettes using the two classical methods and a correction factor is computed, relative to the known, total, volume. On real data, individual orientations and volumes are unknown but the correction factor still holds for the total volume of a large number of organisms. The correction is around -20% for the ESD method and +10% for the ellipsemethod. When applied to a database of »150,000 images of copepods captured by the Underwater Vision Profiler, the corrections decreased the gap between the two methods by a factor of 54. Additionally, the same procedure is used to evaluate the consequence of the bias in the estimation of individual volumes on the slopes of Normalized Biovolume Size Spectra (NBSS) and show that they are not sensitive to the bias.

(Left) A copepod with two ellipse fits: the classical method ZooProcess in red, affected by the antennae, and the proposed method in green, that fits the prosome of the copepod better. (Right) Total volume estimated by two classical methods, ESD (blue) and ELL (red), as computed by ZooProcess (ZP) and by the proposed method, without final correction (\tilde{W}) and with final correction (\hat{W}).
Optimal transport for classification
Participants: Sarah Laroui, Eric Debreuve, Xavier Descombes.
Publications: TBA
We have developed an alternative classification approach based on optimal transport whose strength lies in its ability to consider the geometry of the sample distribution. We proposed to transformthe data so they follow a simple model (in practice a Gaussian model), the complexity of the data then being “hidden” in the transport transformation. This approach also offers an original way to estimate the probability density function (PDF) underlying a population sample. For that, we used optimal transport (OT) to transform one distribution into another at a lower cost. In our case, we transform the starting data into data that follows a normal distribution. Thus, for each class, we generate a Gaussian with the same Mean and variance as the starting distribution. We learn the transport between source and target samples. Then we transport the samples via the learned transport, and we calculate source sample PDF values using the position of the transported samples and the parameters (mean and variance) of the class distribution. An extrapolation function is then learned based on the class samples and the recovered PDFs. Finally, we obtain for each class, amodel that gives the PDFs of any sample.

Classification steps using optimal transport domain: (A) One optimal transport learned per class between initial class distribution and the target (Gaussian data). For each class, the samples are transported via the learned OT and the PDF of the class samples are calculated. (B) and (C) corresponds to the case of class 1 samples.
Fungus growth model
Participants: Sarah Laroui, Eric Debreuve, Xavier Descombes.
To model the growth of the Botrytis cinerea fungus, we consider a fungus as a tree structure whose growth is an iterative process for which some events must be defined, and the probability of their occurrence computed. We first acquired several microscopy time lapses of growing fungi. The first step is to segment the fungi. We used a Canny-based procedure. After segmentation, we corrected the masks according to an inclusion hypothesis (fungi do not move and can only grow). Then, the fungi are tracked over time using the classical overlapping hypothesis. Finally, we extracted the fungi skeletons, converted them to a graph, and computed three parameters per fungus: the total length of the skeleton and the number of primary and terminal branches. From these data, we studied the length parameter evolution over time, and chose an exponential law as the length evolution model. The law coefficients were estimated independently for each fungus using the least square method, and their respective distribution was computed. This allows to generate realistic random length evolutions. We also studied the branch creation events over time. We concluded that this event occurrences do not exhibit any particular trend. The proposed fungus growth simulator represents a fungus by a tree graph whose first node corresponds to the initial spore. A branch is composed of one or more edges. The fungus growth is generated by successive creations of edges without thickness notion. At each time (or iteration), the graph branches lengthen by an additional edge. Additionally, a new branch can be created, either from a terminal node (split at the ending point of a branch) or from the initial (spore) node, by adding a new edge according to a Bernoulli law. Each of these additions of edges relies on two parameters: a length and an angle. The length depends on coefficients drawn according to the distributions previously estimated in the exponential law context, and on the number of edges to be created. The angle is drawn randomly within fixed intervals.

Examples of fungus growth (A) and simulation (B) at times 0, 30, 100.
Simultaneous vascular network segmentation and classification using a multitasks semi-supervised neural network
Participants: Rudan Xiao, Xavier Descombes.
Publications:MICCAI2021, ICDTA 2021
Vascular network analysis is crucial to define the tumoral architecture and then diagnose the Renal Cell Carcinoma (RCC) subtypes. However, automatic vascular network segmentation from histopathological images is still a challenge due to the background complexity. We propose a method that reduces reliance on labeled data through semi-supervised learning (SSL). Additionally, considering the correlation between tumor classification and vascular segmentation, we propose a multi-task learning (MTL) model which can simultaneously segment the vascular network using SSL and predict the tumor class in a supervised context. This multi-task learning procedure offers an end-to-end machine learning solution to jointly performvascular network segmentation and tumor classification. We computed the ratio of miss-detected vessels (MV), the ratio of falsely detected vessels (FV) and the global performance index (IV) to evaluate our segmentation results. Figure below shows the segmentation results of the proposed MTL.

Segmentation results obtained by using the proposed model.
RCC classification using a deep neural decision tree
Participants: Xavier Descombes.
Publications: TBA
Renal cell carcinoma (RCC), which typically emerges from the renal tubules, is currently categorized into fivemain histological sub-types: clear cell, papillary, chromophobe, collecting duct, and unclassified RCC. Among them, the three most common RCCs types are clear cell, papillary, and chromophobe, including 70% to 80%, 14% to 17%, and 4% to 8% of all RCCs, respectively. Collecting duct carcinoma is the most uncommon class of RCC (1%), and unclassified RCCs gathers those alien types which do not fit, morphologically or cytogenetically, into any of the above four sub-types. The CNN (Convolutional Neural Network) appears to be a successful approach for image classification purposes. However it leads to data-hungry supervised algorithms, requiring ten of thousands of annotated images to be proficiently trained. This aspect is still an open issue that limits CNN usability in the everyday clinical setting. Transfer learning (TL), which leverages knowledge from related domains (called source domains) to facilitate the learning in a new domain (called target domain), is known to be a good solution to this problem. Originally defined as a research problemin machine learning that focuses on storing knowledge gained while solving one problem and applying it to a different but related problem, TL was initially considered capable of shifting and reusing knowledge between two similar/related domains of interest. For instance, using features embedding extracted from a nudity detection model into a new facial recognition task. Nonetheless, debate continues about the practicability of TL-based embedding in contexts distant from the original training domain, or in presence of a limited number of annotated samples. In this regard, the termnegative transfer (NT) specifically refers to situations where the source knowledge can have a negative impact on the target learner, causing reduced learning performance in the target domain.
In this study,we applied several TL-based and full-trained state-of-the-art CNNs in the RCC sub-typing task. We show how both these learning paradigms failed, and, specifically, how TL led to NT, producing not satisfactory performance in the target domain. As a matter of fact, RCC sub-typing task includes those conditions known to be cumbersome even for TL-based solutions: a complex classification task, well-known to be arduous also for skilled pathologists showing a limited number of annotated samples. Our results proved on the one hand that canonical TL from general propose images, and even from other histological source domains, fail, inducing NT.We proposed a hybrid approach, leveraging a combination of TL and expert knowledge, that we named as DeepRCCTree, which was able to outperform several state-of-the-art CNNs in subtyping the RCC cancer. The different binary classification tasks, included in this decision tree, are directly inspired by the histopathologist practice.
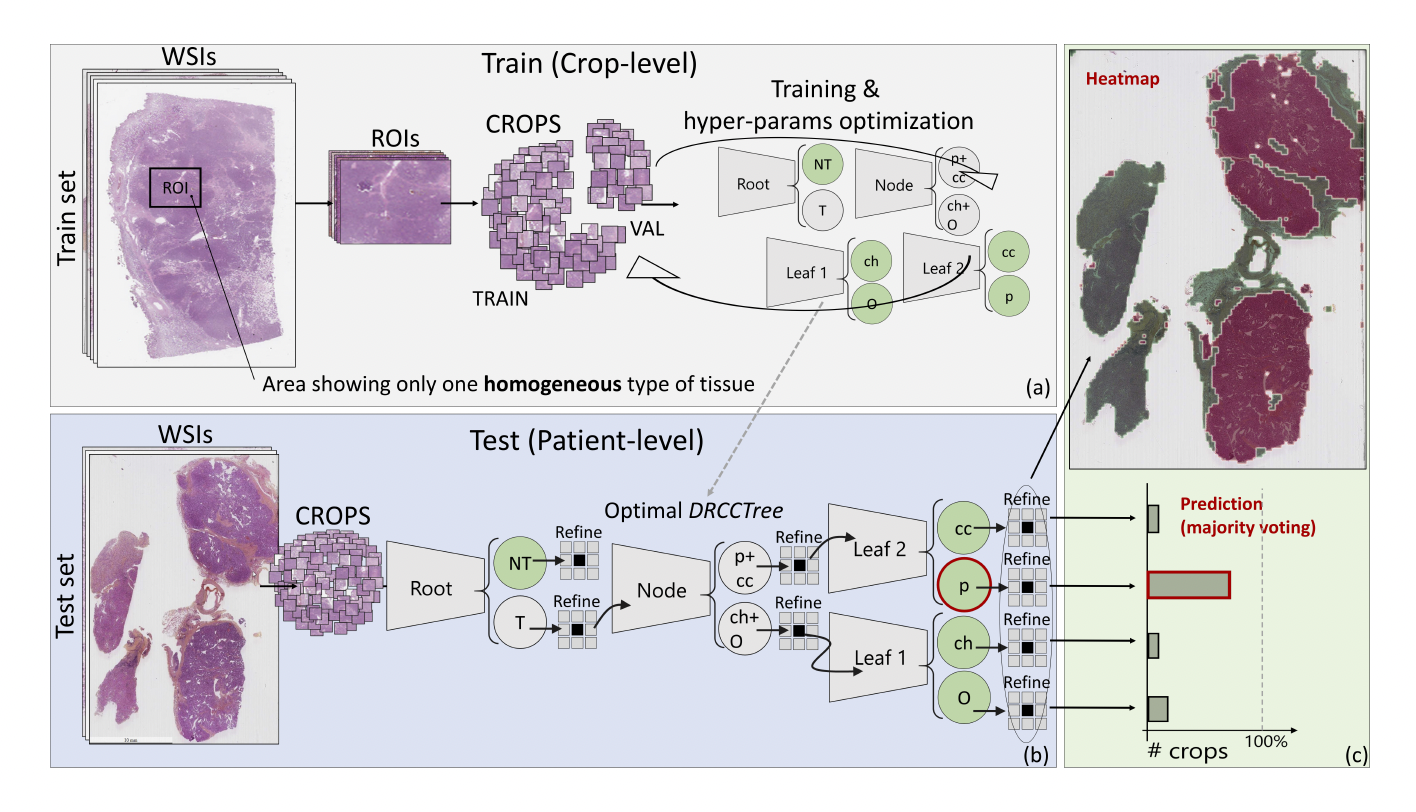
Expert-based decision tree based for histopathological image classification.
Robust plant cell tracking
Participants: Gregoire Malandain.
Publications: ISBI2022
Automatic tracking of cell deformation during development using time-lapse confocal microscopy is a challenging task. In plant cell tissues, large deformations and several division cycles can occur between two consecutive time-points making the image registration and tracking procedure particularly difficult. Here, we propose an iterative approach where an initial registration transformation and cell-to-cell mapping are alternatively refined using high-confidence associations selected on the basis of a geometric context preservation score. The method, evaluated on a long time-lapse series of floralmeristem, clearly demonstrates its superiority over a non-iterative approach. In addition, we show that the geometric context preservation score can be used to define a lineage quality assessment metric that makes it possible for an expert to provide locally nudges to finalize the lineage detection if necessary in a semi-automatic way.
Ascidian embryo cell naming
Participants: Gregoire Malandain.
Publications: Science
Since the pioneering work of Conklin, it is admitted that ascidian exhibited a stereotyped development in the first stages of their embryogenesis. As a consequence, embryo cells can be unambiguously canonically named after their fate: this provides a common reference space into which population of inviduals can be projected and compared. Moreover, this stereotypy also provides a means to name a new sequence from already named ones. In [m:guignard:hal-02903409], we proposed a pipeline to segment and track the embryo cells over several generations from a temporal sequence of light-sheet microscopy 3D images. This provides not only the cell segmentations and lineage but also numerous quantitative measurements (volume, contact surfaces). This work resulted in 10 developing embryos almost entirely named (through visual inspection), or atlases. We hypothetized that the development stereotypy induces cell neighborhood invariance. Thus the cell neighborhood can be viewed as a cell fingerprint. The definition of cell-to-cell as well as division-todivision distances allows then to name a newly acquired embryo from one or several atlases. As a side result, it also providesmeans to investigate the developmental variability at a cellular level.

Two ascidian embryos with cells colored according to their name: this emphasize the development stereotypy.
Morphogenesis of the sea urchin embryo
Participants: Gregoire Malandain.
Publications: TBA.
The project aims at understanding the mechanisms driving the larval gut formation in the embryo of the sea urchin Paracentrotus lividus. We use the Astec pipeline to process several sets of data and performed targeted quantifications to improve our understanding of the archenteron formation. The sea urchin embryo is composed of a simple epithelium– a layer of mechanically coupled cells – forming a hollow, bell-shaped organism. At a given point of the embryo – known as the vegetal pole, the epithelium folds and elongates concomitantly to formthe rudiment of a tube, the archenteron.

3D segmented images of a sea urchin embryo at the onset of the archenteron invagination (left) and during the invagination (right).
One mechanism commonly found in various model systems that drives tissue folding is apical constriction: a group of cells reduce their surfaces on one side and expand on the opposite side. In the sea urchin embryo, a ring of apically constricted cells is indeed present during archenteron invagination (blue cluster on Figure below A). Nevertheless, we also imaged and analyzed a mutant that does not display archenteron invagination: the ring-shaped cluster of apically constricted cells is present too (Figure below B), with similar characteristics (number of cells and level of constriction) (cf Figure C&D). Hereby we demonstrate for the first time that apical constriction is not sufficient to drive archenteron folding in the sea urchin embryo. Various mechanisms may drive tissue elongation; nevertheless, neighbor exchange via cell intercalation is often found to be a key factor of extension in morphogenetic processes.
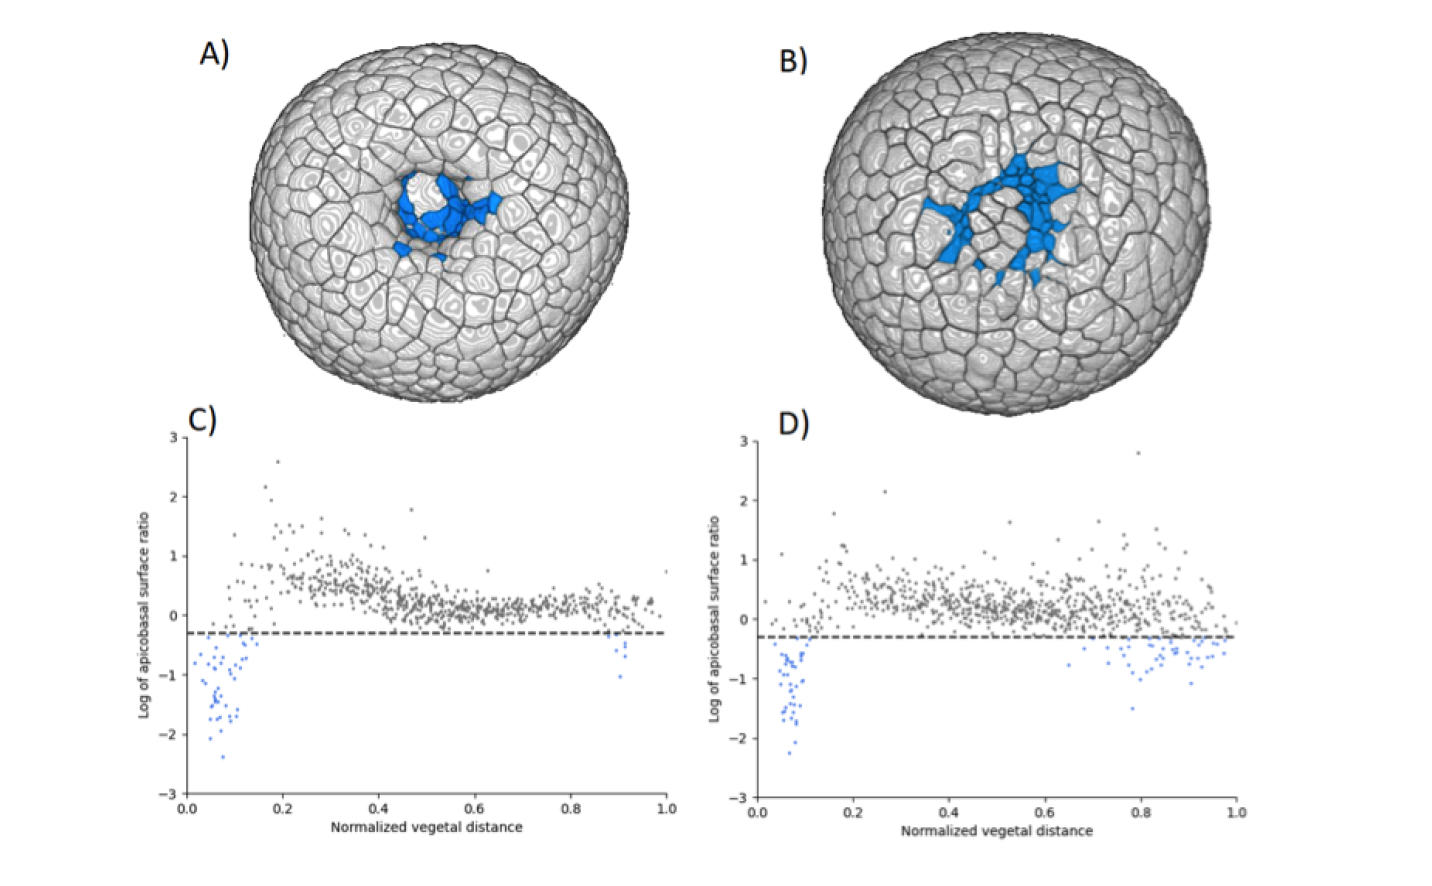
(A-B) 3D renderings of sea urchin embryos and (C-D) plots the apical over basal area ratio as a function of the distance to the vegetal pole. One dot represents one cell; the horizontal dashed line corresponds to apical area = basal area/2. On the x-axis, 0 corresponds to the vegetal pole and 1 to the animal pole (at the exact opposite from the vegetal pole). (A-C)WT embryo and (B-D) mutant embryo where the archenteron does not invaginate.