
Context
Atrial fibrillation (AF) is the most common sustained heart arrhythmia. Ventricular fibrillations (VF) are more dangerous and are responsible for sudden cardiac death.
The LIRYC institute is one of six French university hospital institutions created in 2011 as part of the ”investments for the future” program (”Investissements d’avenir”) to boost medical research and innovation.
This institute, headed by Professor Michel Haissaguerre with clinicians from the University Hospital of Bordeaux and basic scientist teams is devoted to understanding the mechanism of AF and VF and developing new approaches to treat these cardiac pathologies. Carmen is an Inria team that is involved in the LIRYC institute by offering the modeling and simulation component of the project. One of the most used interventions to prevent and/ or stop VF and AF is radio-frequency ablation. This intervention requires an accurate targeting of the substrate to be ablated. The recent non-invasive technology used in guiding medical doctors to target these substrates is based on an inverse electrical mapping technique also known as electrocardiographic imaging (ECGI). With this approach, potentials on the outer (epicardial) surface of the heart are computed from potentials measured on the body surface using information on the geometry of heart and the 3D locations of measured potentials. This is exactly the data completion Cauchy problem for elliptic equations. An ECGI mapping system was approved for use in Europe in 2011 and is available for clinical and basic science research at the LIRYC Institute in Bordeaux.
The ECGI procedure
One of the most recent heart imaging techniques introduced recently to the clinical industry is the electrocadiography imaging (ECGI). This technique allows a non-invasive reconstruction of the electrical potential on the heart surface based on electrical potential measurement on the body surface and anatomical data of the torso. It has been a research topic for decades and it is now under clinical assessment in different leading hospitals around the world. ECGI provides very precious informations about the heart condition since it is able to provide refined spatial description of the electrical wave pathway and magnitude on the heart surface. This helps a lot in different clinical interventions like radio-frequency ablation usually used to stop atrial and ventricular arrhythmias. We work together with cardiologist from CHU de Bordeaux in order to improve the algorithm behind the inverse problem solving.
In order to solve the ECGI inverse problem many steps have to be taken into acount: image segmentation, mesh generation, mathematical approaches, numerical algorithms and scientific visualization.
Image Segmentation and Mesh Generation
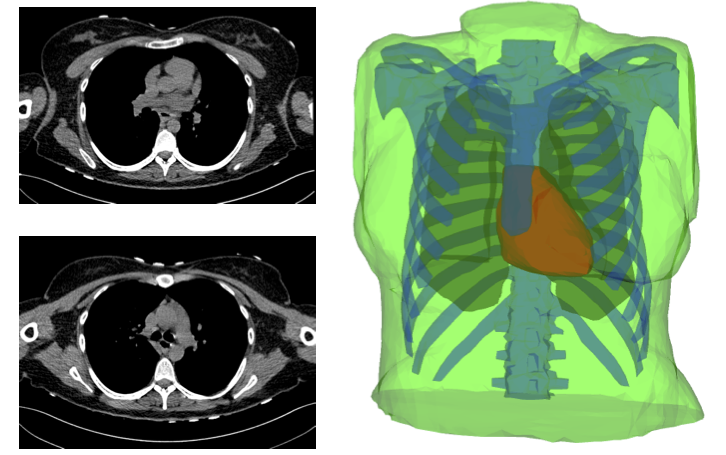
We use anathomical geometries provided by CHU de Bordeaux. Here is an exampmle of a CT scan of a 43 year old woman. We first segment the DICOM images, we identify the main regions in the torso domain: heart, lungs, bones, and the rest of the torso tissue. After segmentation, we use Tetgen MMG3D meshing Software in order to get a good quality of athetrahedral mesh.
Mathematical methods
The most widely used mathematical formulation used to solve ECGI inverse problem is a least square equation minimizing the gap between the measured ECGs and potentials mapped from the heart to the torso using a transfer matrix. This problem is ill posed since the transfer matrix it self could be a rectangular matrix. Many approaches have been used in the litterature to regularise the problem. In this project we aim to provide novel formulation of this inverse problem and compare them to the state-of-the-art procedure.
Numerical Algorithms
Numerical algorithms are computer implementation of the mathematical methods on the computational geometries.
They have to be very acccurate but also sufficiently fast in order to be used in clinical applications
They have to be very acccurate but also sufficiently fast in order to be used in clinical applications
Visualization
Numerical algorithms provide tables with numbers. The interpretation of this data is difficult without a good representation.
Visualization tools, like paraview, help in representing this data with images and movies that medical doctors could easily interpret.
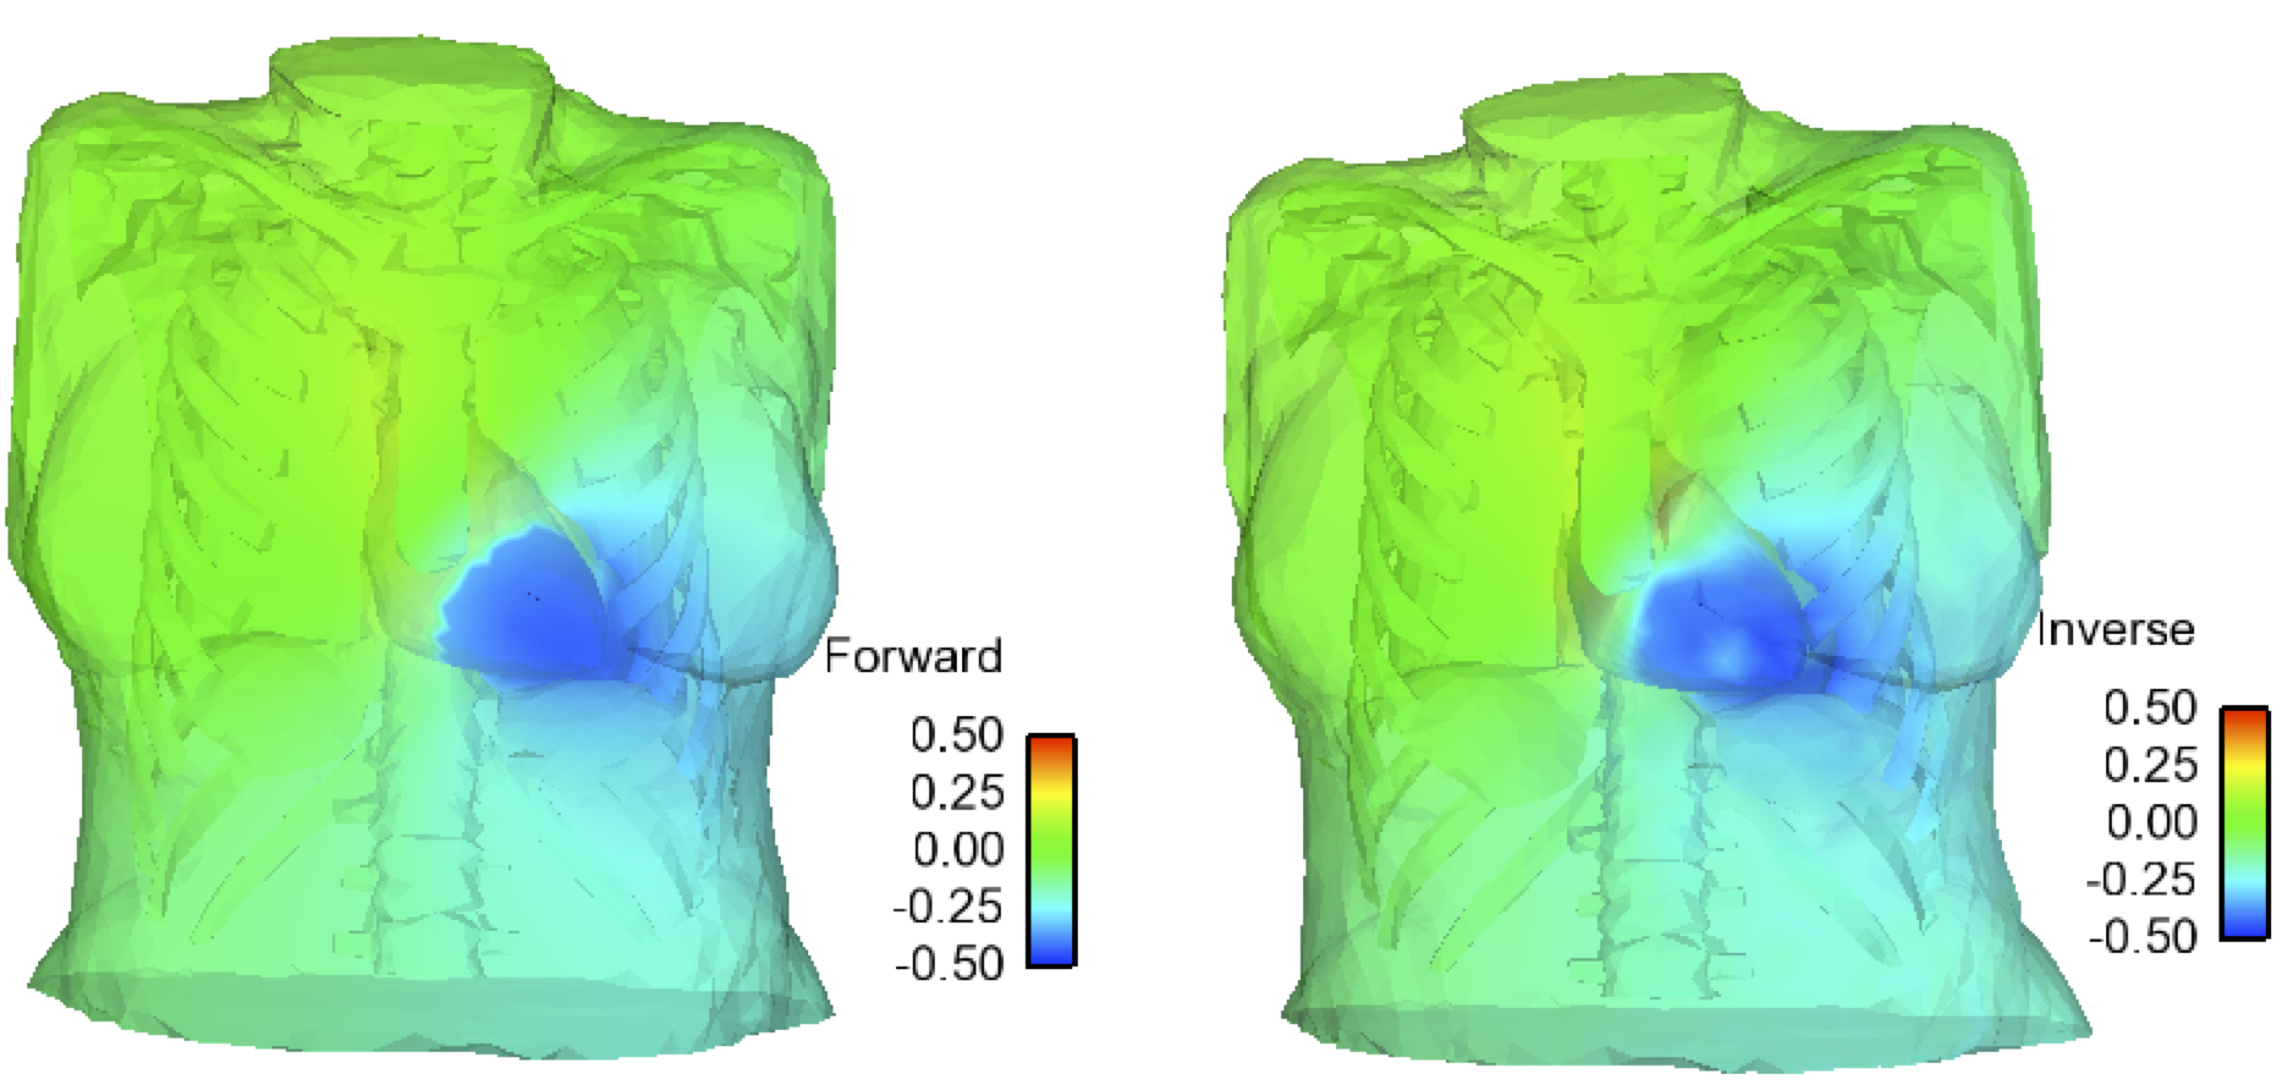
Example of normal case
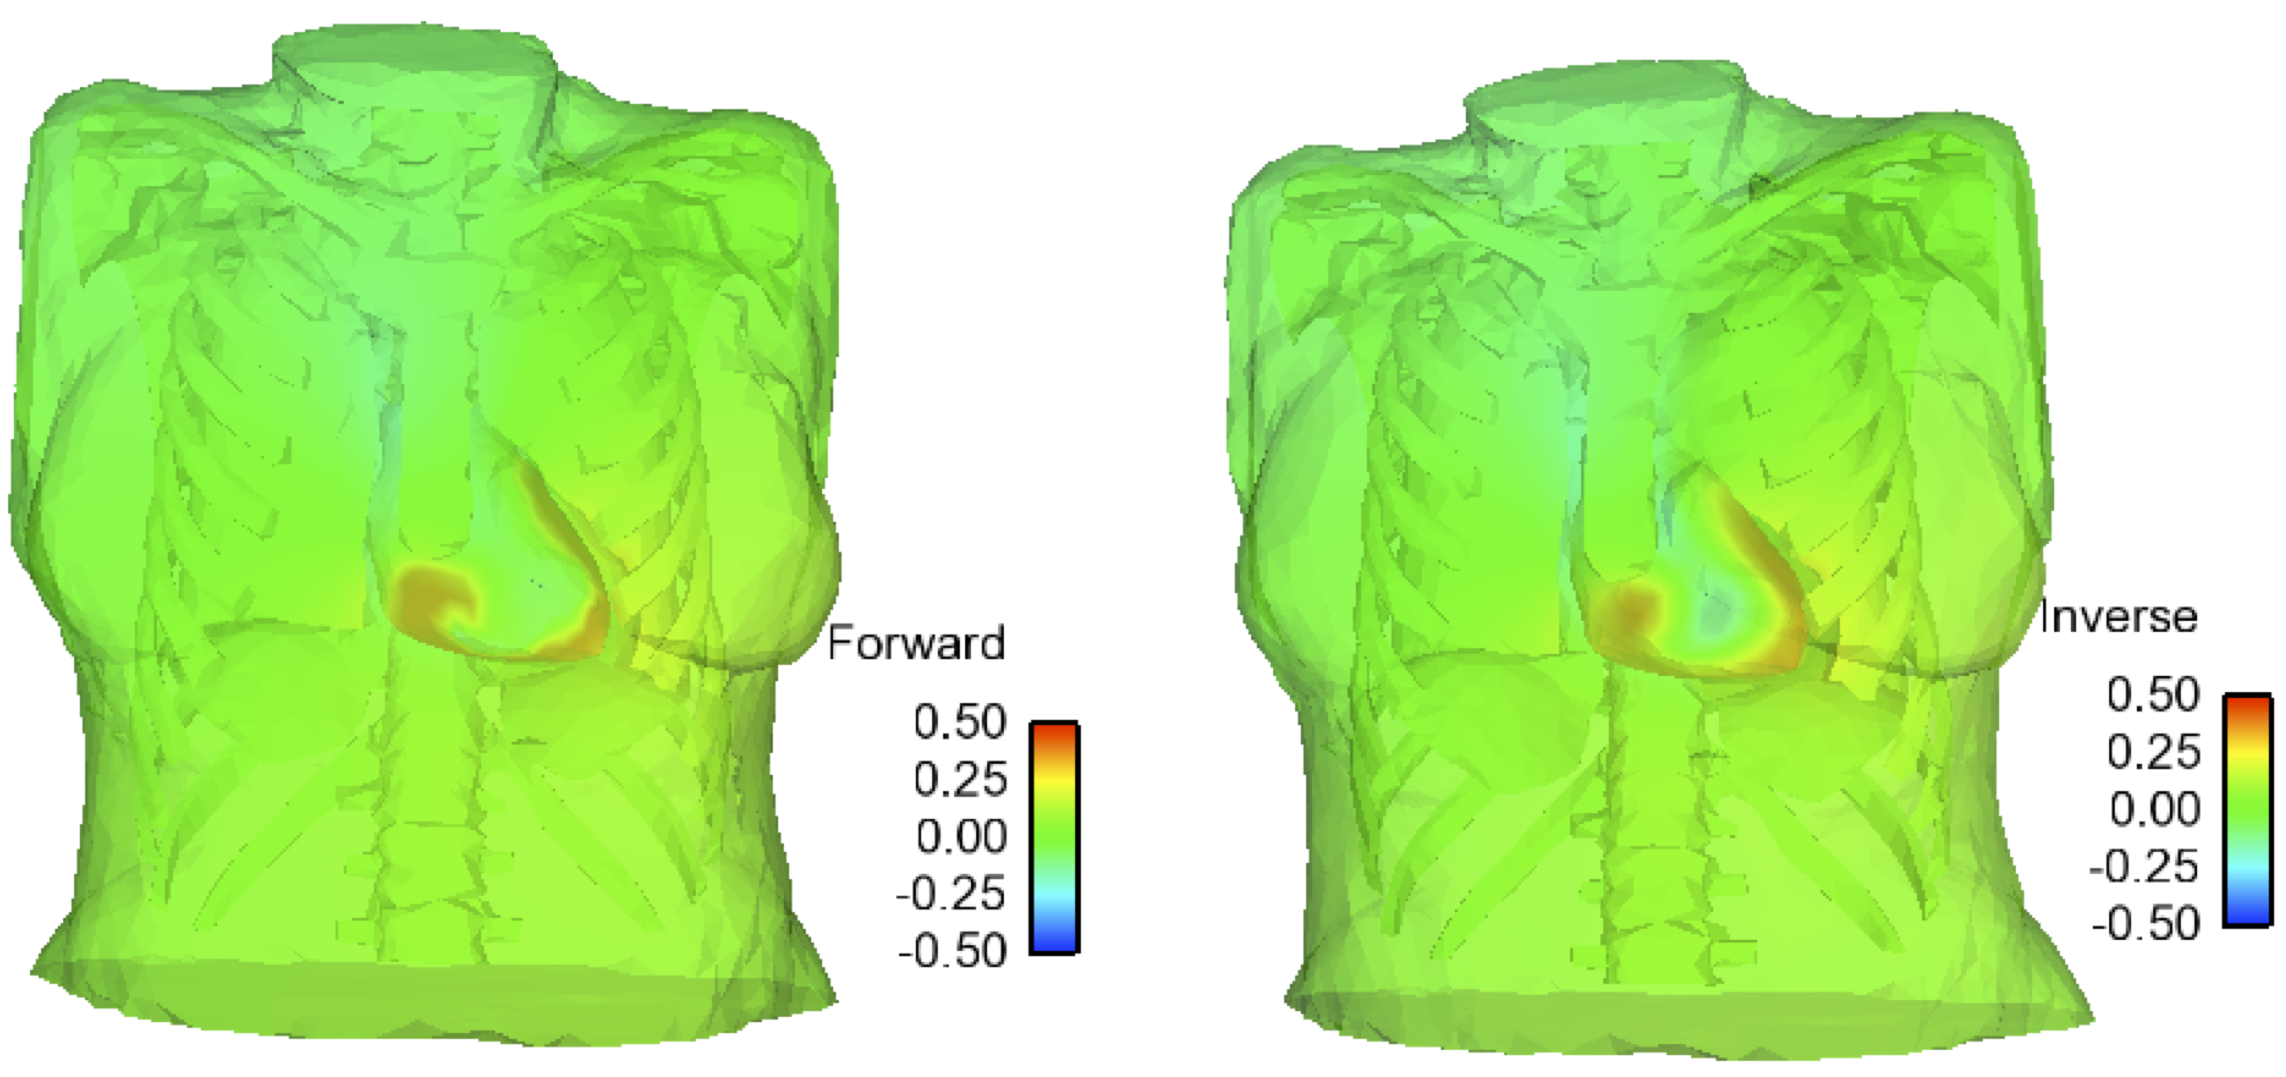
Example of a re-entree case
Gallery of results
[youtubegallery]
[/youtubegallery]