


Three-dimensional blood flow in large arteries
Blood flow is known to be affected by and have an effect on the development of various congenital or acquired vascular diseases. Medical devices such as grafts can alleviate these pathologies, but at the same time may disturb local blood flows and endothelium function, inducing undesirable secondary effects. Three-dimensional (3D) numerical simulations of hemodynamics can give access to these local quantities and may therefore help design new medical devices with less negative impacts or improve surgery planning. They also provide a hemodynamics characterization of a pathology or of a preoperative state before a surgery is performed.
Scientific goals that aim at bringing simulations closer to the clinic:
(G1) to take into account clinical data
(G2) to design methods for robust, yet efficient simulations
For the different targeted applications specific methods or strategies are developed to address the challenges of patient-specific blood flow modeling:
- The project starts by identifying with the clinician the question to be answered together. Typically, this leads to extract and analyze the relevant clinical information needed to perform patient-specific simulations (geometry of the vessels at different time points, pressure and/or flow measurements, etc.).
- Simulations are done on a restricted domain (typically a few vessels), which is yet part of an entire circulation. The latter is represented by the boundary conditions at these artificial boundaries. However hemodynamics measurements (pressure, flow) are in general not acquired at these locations. A multiscale strategy is thus warranted: it consists in coupling the 3D domain with reduced models (1D, 0D) of the rest of the circulation.
- Another challenge is to estimate model parameters (boundary conditions or parameters of the reduced models, vessel wall compliance, etc.) that are not directly extractable from the measurements. This is done through various inverse methods that require preliminary simulations.
- The interaction of patient specific geometry and physiological flows often leads to a complex flow. This creates numerical instabilities at the artificial boundaries. We are thus developing and comparing numerical methods that can handle this complexity, perturbing as least as possible the natural flow.
- Simulations need to be post-processed to extract the information that is relevant for the application. Local (wall shear stress, lagrangian coherent structures, etc.) or global (power loss, etc.) quantities are computed.
- Analysis of the question at hand can then been done: evaluation of or correlation with clinical indices, surgical design comparison or optimization, sensitivity analysis to input parameters, validation with clinical data.
The Multi-scale Modeling of Single Ventricle Hearts for Clinical Decision Support is an example of such project in which clinicians and engineers/mathematicians work together. We present here four typical steps in this work.
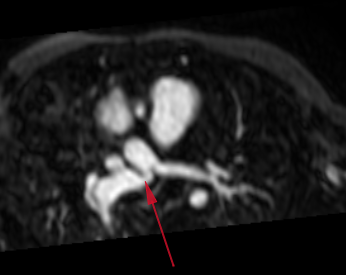
Step 1: patient specific clinical data: geometry (Magnetic Resonance Angiography – MRA), flow (Magnetic Resonance Imaging – MRI, echo Doppler ultrasound) and pressure (catheterization)
The imaging shows a kink into the right pulmonary artery (red arrow below).
Clinical question: does this narrowing significantly affect hemodynamics, e.g. generate a non-negligible pressure loss?
Step 2: patient specific multiscale coupling
3D Navier-Stokes equations (in the red domain) coupled to a 0D model representing the rest of the circulation (electric analog, small black boxes representing the rest of the lung circulation with RCRCR lumped models). The green ellipse represents the part that will change in the virtual surgery.

Step 3: preoperative computational fluid dynamics
Velocity color-coded streamlines in an unsteady 3D-0D simulation of a Norwood patient
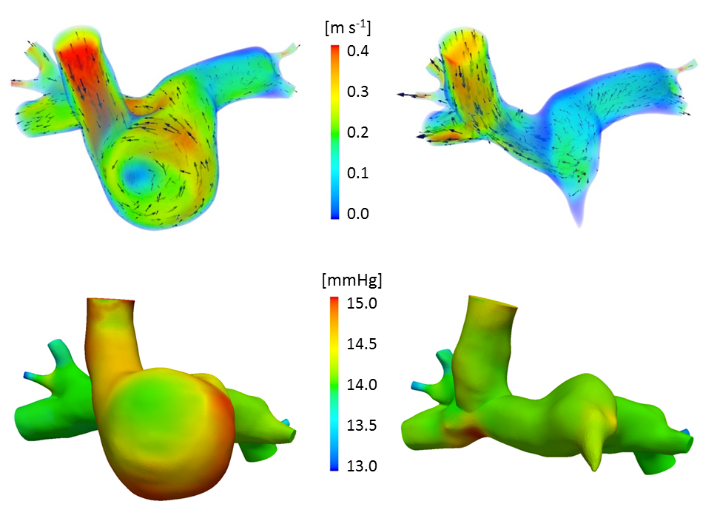
Step 4: virtual comparison of two commonly performed surgical options:
Top: velocity magnitude; bottom: pressure. Hemi-Fontan (left) vs Bidirectional Glenn (right) cavopulmonary connections.
1D-0D closed-loop model: liver surgery modeling
Motivations
- Major liver resection (partial hepatectomy) is performed to treat liver lesions or for adult-to-adult living donor liver transplantation.
- Surgery complication may occurre due to a poor post-operative liver function (post-operative liver failure).
- Liver hemodynamics plays a role in post-operative liver failure.
Goals
- Investigation with mathematical models of the impact of liver surgery on hemodynamics.
- Reproduce the observed waveform changes.
- Pressure and flow in the main vessels of the liver have been recorded for different resection percentages on pigs. At the resection time, waveform changes were observed repeatedly in the pressure and flow measured in the hepatic artery (artery entering the liver).
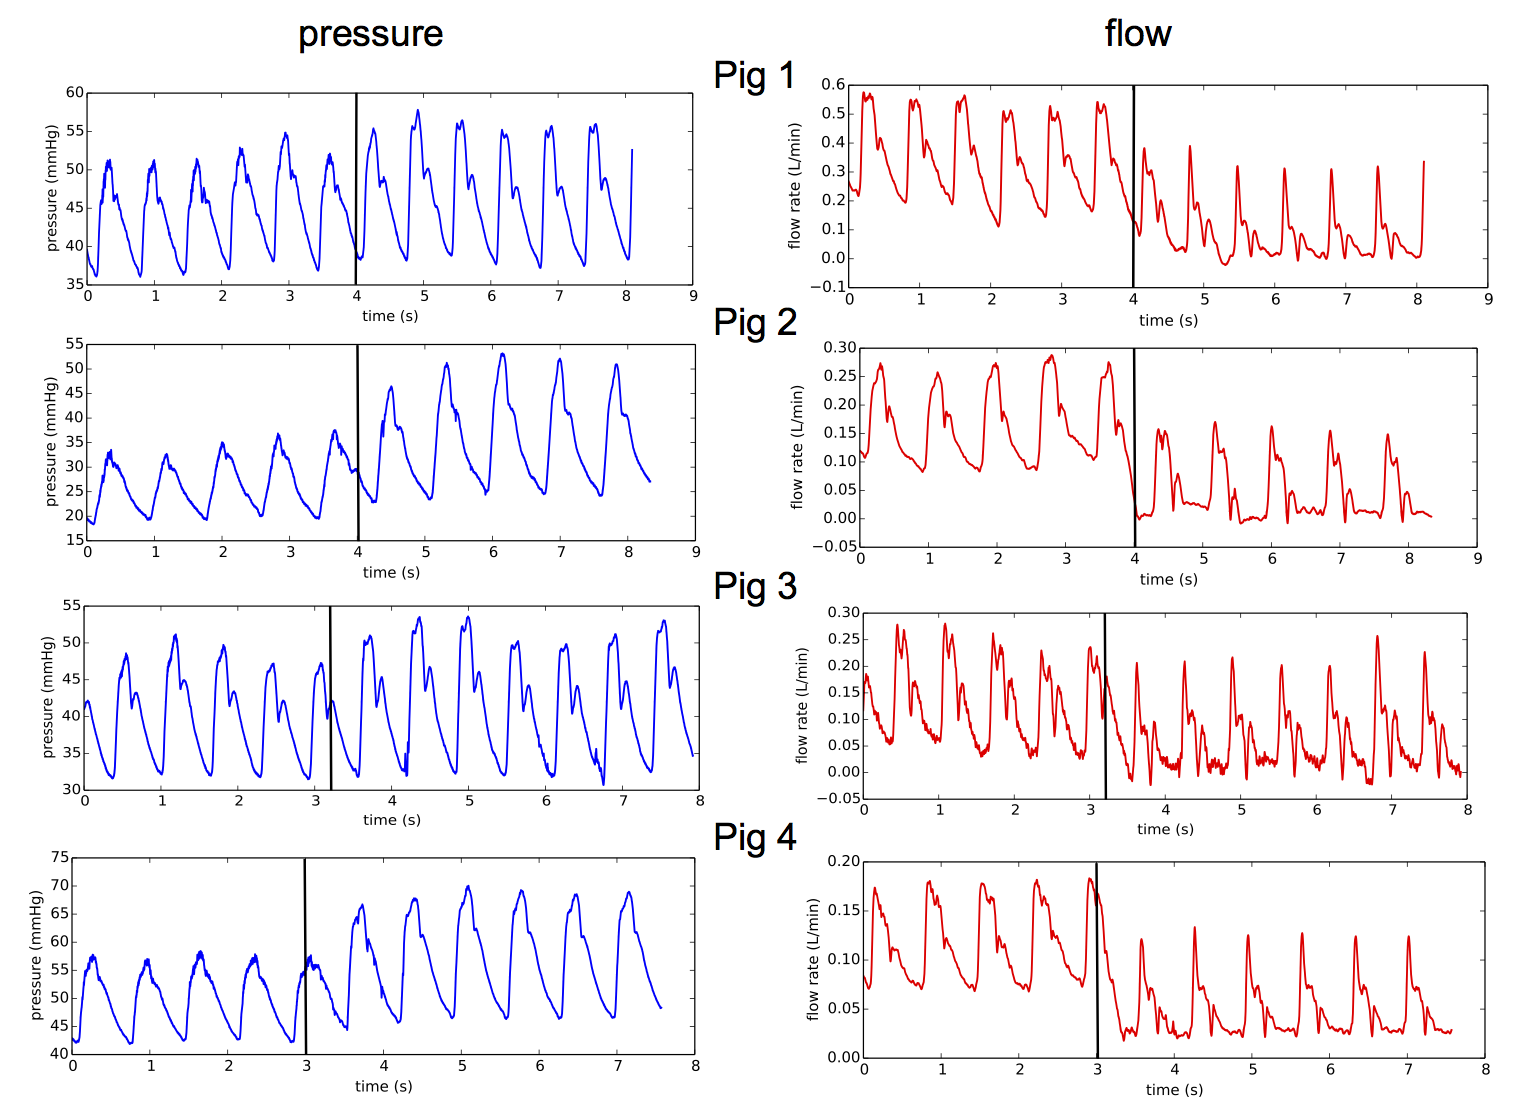
Pressure and flow measurements in hepatic artery at the resection time for 4 different animals, black lines indicate the resection time.
Mathematical modeling
Modeling approach
- Liver receives 25% of cardiac outflow, therefore the surgery may impact the whole circulation: development of a closed-loop model of the blood circulation.
- Reproduce the observed waveform changes: model enabled to capture wave propagation, the network of artery is modeled by systems of the one-dimensional (1D) hyperbolic Euler equations.
Closed-loop 1D-0D model
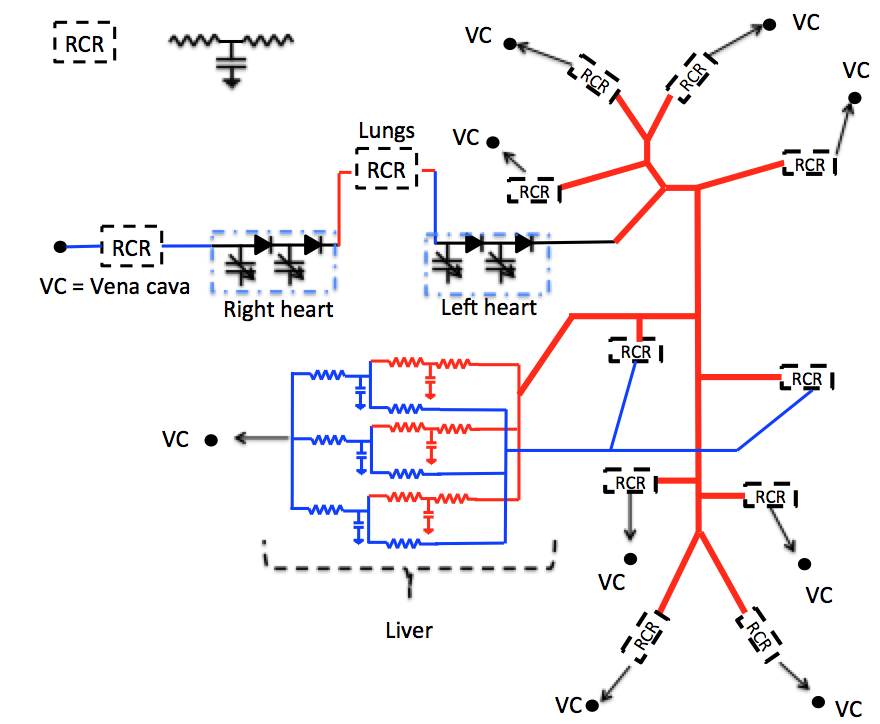
Schematic representation of the 1D-0D closed-loop model for porcine blood circulation including a 3-lobe liver model. 1D blood flow is simulated in the thick lines arteries while thin lines represent the 0D model connections. All RCR units and the liver are linked (thin arrows) to the vena cava (VC).
Simulation results
75% liver resection simulation (remove 2 of the 3 main liver lobes, increasing the corresponding lobe resistances).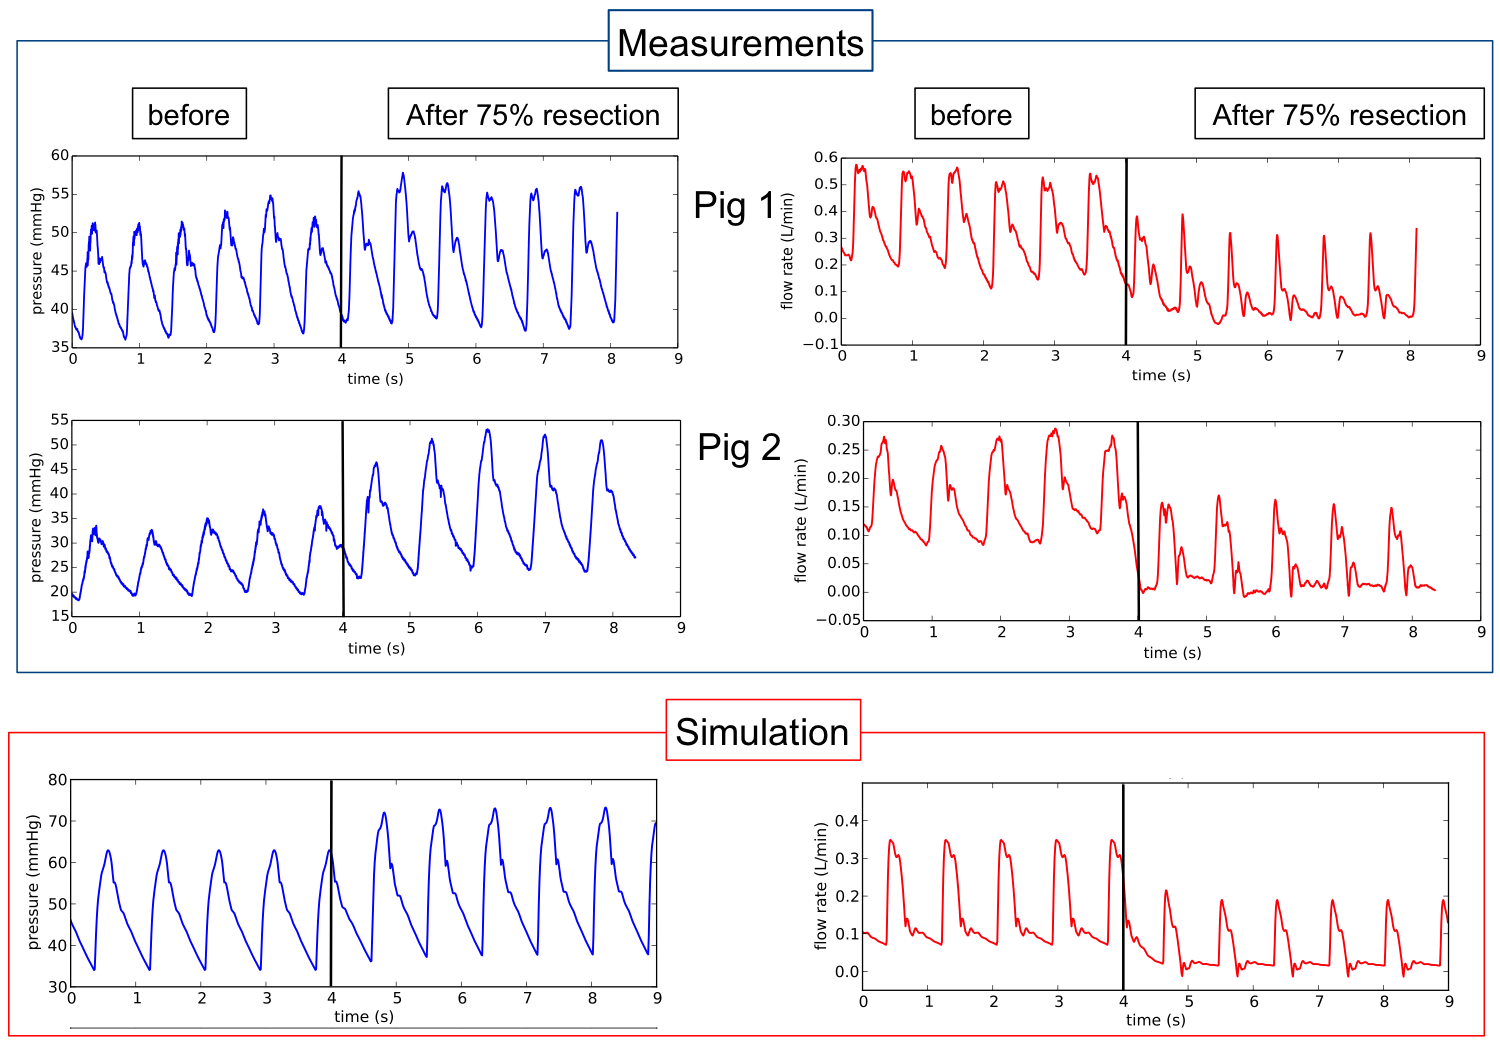
75% – 90% liver resection simulation (resection of a part of the remaining lobe, reducing the lobe mass i.e. changing the lobe model parameters).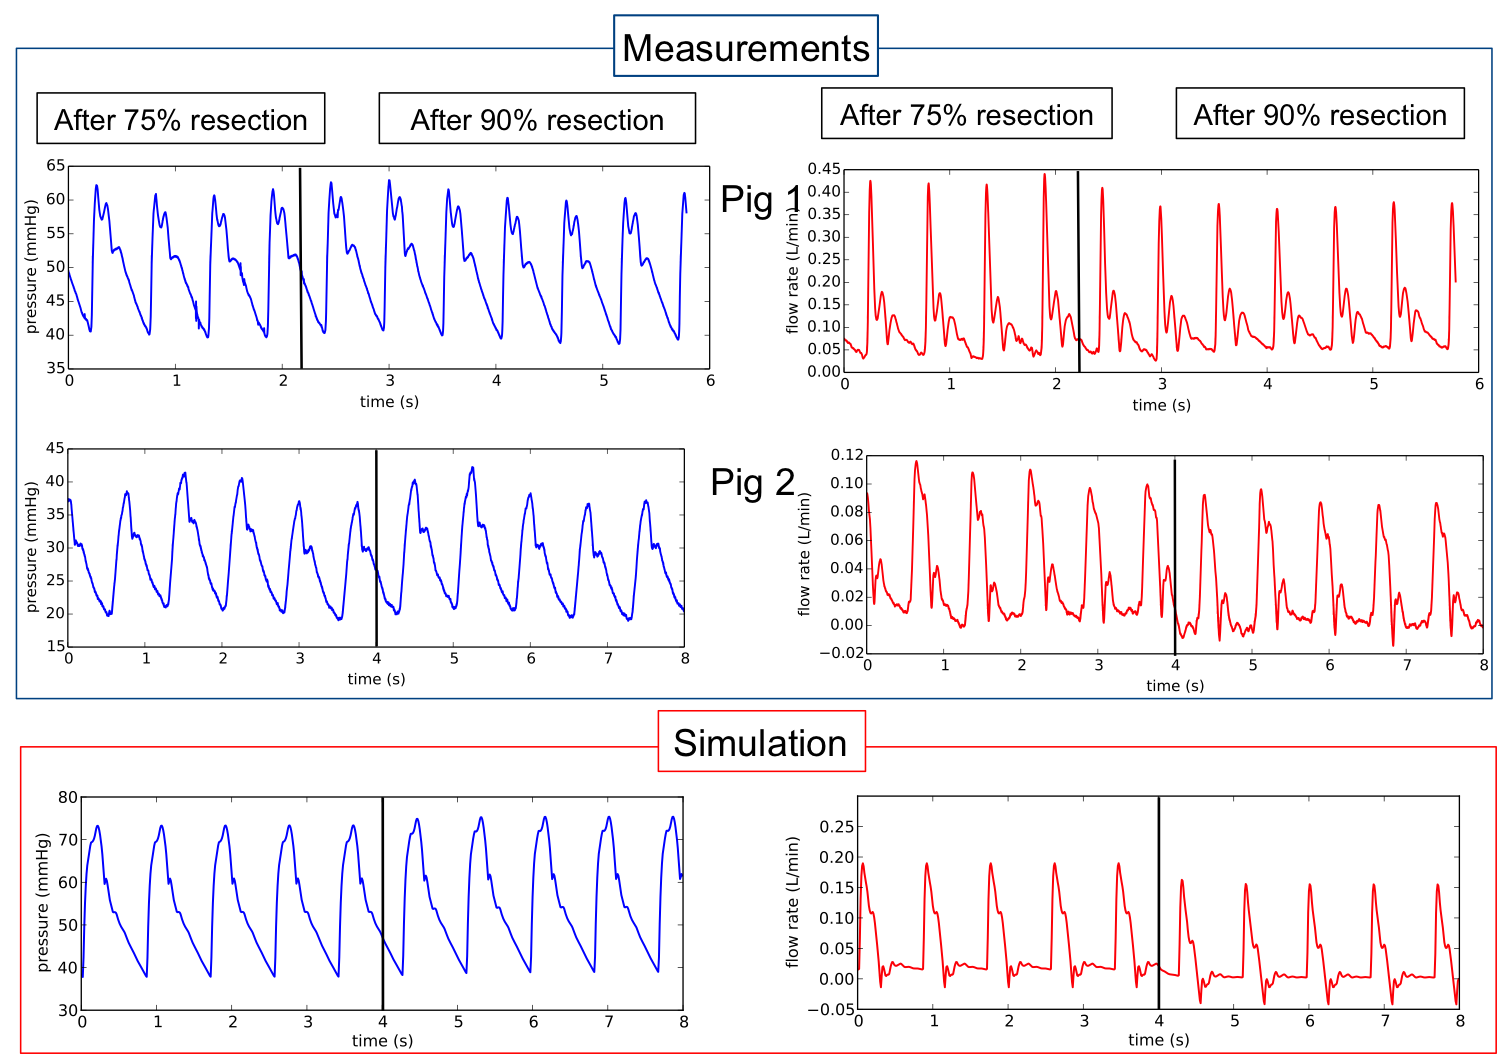
Interpretation
The capability of the model to represent this complex behaviour allowed us to propose possible explanations of the observed phenomenon.
The fact that changes in hepatic artery flow waveform during experiments are observed for 75% resection but not for 90% hepatectomy, can be explained by the change in architecture in the blood vessel trees. Indeed, in the first resection, two of the three liver lobes are removed, which leads to an important architecture change. For the second resection, the remaining lobe mass is decreased and the vessel tree architecture does not change as much.